Concord Consortium
Summertopia
What if the unit of money changes tomorrow? Would you be prepared? Learners calculate currency conversions using fictional units of money. The fictional unit's base is 60 rather than 100, which can connect to time or even degrees.
Concord Consortium
Stocking the Shelves
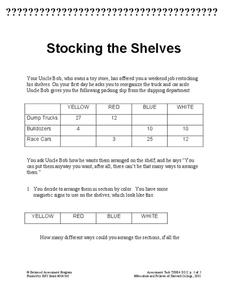
How many ways can you stock a shelf? It's probably more than you think! Young scholars use data in a frequency table to determine how many ways to stock a shelf given a specific constraint for types of groups. They then repeat the task...
Concord Consortium
Sum and Product
From linear to quadratic with a simple operation. An exploratory lesson challenges learners to find two linear functions that, when multiplied, produce a given parabola. The task includes the graph of the sum of the functions as well as...
Concord Consortium
Heights and Weights
Height is dependent on weight—or is it the other way around? Given data from a physicians handbook, individuals compare the height and weight of males and females at different areas. They calculate differences and ratios to assist with...
Concord Consortium
Gestation and Longevity
Is the gestation length of an animal a predictor of the average life expectancy of that animal? Learners analyze similar data for more than 50 different animals. They choose a data display and draw conclusions from their graphs.
Concord Consortium
Function Project
What if a coordinate plane becomes a slope-intercept plane? What does the graph of a linear function look like? Learners explore these questions by graphing the y-intercept of a linear equation as a function of its slope. The result is a...
Concord Consortium
Boards IV
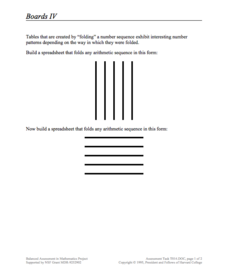
Build a connection between algebraic sequences and spreadsheets. Learners examine a specific folding pattern and convert the pattern into a spreadsheet. The goal of the spreadsheet is to produce a sequence of a specific pattern modeled...
Concord Consortium
Boards III
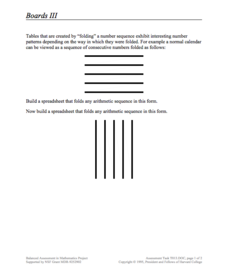
Learn to visualize mathematical patterns as a folded pattern. Beginning with a visual display, the task encourages pupils to view sequences as a folded table. The pattern of the table then becomes a formula in a spreadsheet that...
Concord Consortium
Boards II
Build spreadsheet skills while investigating decimal multiplication. An open-ended task asks learners to edit a spreadsheet to create a multiplication table for decimals. Provided with a specific interval, pupils create formulas that...
Concord Consortium
Crazy Clocks
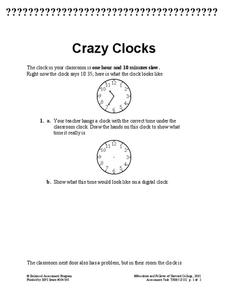
While a stopped clock is right twice a day, a fast or slow clock confuses people for weeks. Scholars observe a clock running slow and must correct it before observing a clock running fast and working it backward. Finally, a multi-step...
Concord Consortium
Cities and Gas Stations
In Utah, one stretch of highway goes for 106 miles without a single gas station. Where should people build one? Scholars face the dilemma of where to place a new gas station between three cities. They consider distance and proximity to...
Concord Consortium
Broken Spreadsheet I
There is power in spreadsheet formulas and learners use this power to model quadratic data. Given a scatterplot of a parabola, pupils create formulas in a spreadsheet to populate the data. The formulas they use lead to an understanding...
Concord Consortium
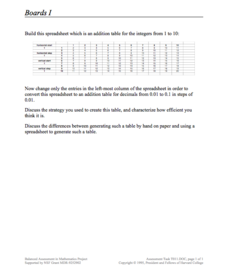
Boards I
Learners create patterns in a table to mimic the function of an electronic spreadsheet. The result is a table that creates an addition table for decimals in intervals of one-tenth. While creating the pattern, pupils must thoroughly...
Concord Consortium
Catching Up
Class members have some catching up to do. Given a linear equation describing the distance of a runner, young mathematicians interpret the equation in terms of the context. They consider a general equation of the same form and describe...
Concord Consortium
Calculator Numbers
Know thy calculator. Young mathematicians use their calculators to answer a set of questions. They consider how the number of digits the calculator displays affects the answers to calculations. They then find examples of computations...
American Statistical Association
EllipSeeIt: Visualizing Strength and Direction of Correlation
Seeing is believing. Given several bivariate data sets, learners make scatter plots using the online SeeIt program to visualize the correlation. To get a more complete picture of the topic, they research their own data set and perform an...
Concord Consortium
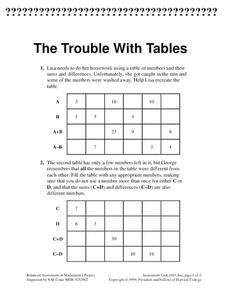
The Trouble with Tables
Tackle these tables. A performance task has learners complete two puzzles using addition and subtraction. They must fill in tables with missing addends, sums, minuends, subtrahends, or differences.
American Statistical Association
Exploring Geometric Probabilities with Buffon’s Coin Problem
Scholars create and perform experiments attempting to answer Buffon's Coin problem. They discover the relationships between geometry and probability, empirical and theoretical probabilities, and area of a circle and square.
5280 Math
Integer Interpreter
Can you add variables if you don't know their value? Using an empty number line, scholars first locate the position of the difference, sum, product, and quotient of two unknown integers. Later problems mix operations as well as add...
5280 Math
Decimal Patterns
Find patterns in the process instead of the result. Learners convert series of decimals and fractions identifying patterns along the way. The lesson includes nine problem tasks with progressively more involved patterns.
Mathematics Vision Project
Module 9: Modeling Data
How many different ways can you model data? Scholars learn several in the final module in a series of nine. Learners model data with dot plots, box plots, histograms, and scatter plots. They also analyze the data based on the data...
Mathematics Vision Project
Module 8: More Functions, More Features
A piece of this and a piece of that, add domain restrictions and create a piecewise function. Young scholars explore piecewise functions with and without context. Functions include both linear and quadratic parts. The module is the...
Mathematics Vision Project
Module 7: Structure of Expressions
The structure of an expression is a descriptive feature. Learners build a solid understanding of quadratic functions using an analysis of expressions in different forms. The seventh module in a series of nine includes 12 lessons...
Mathematics Vision Project
Module 1: Sequences
Sequences are all about recognizing patterns. A module of 11 lessons builds pupils' understanding of sequences through pattern analysis. The practice connects the analysis to linear and exponential equations. This is the first module in...


