GeoGebra
GeoGebra Graphing Calculator
So, exactly, what does it look like? The easily usable graphing calculator allows pupils to visualize the graph of equations and inequalities. The interactive supports any algebraic graph needed for high school mathematics and then some.
Curated OER
Calculating Intervals Using Stokes' Theorem
In this calculating intervals worksheet, students calculate intervals using Stokes' Theorem. They justify their answers with words and pictures. This two-page worksheet contains 3 multi-step problems.
CK-12 Foundation
Expected Value: Game of Chance
Determine whether the payoff is worth it. Pupils calculate the expected value of a game with three different payoff levels. Each level has a different probability of winning money. The scholars find the expected payoffs for each level...
National Council of Teachers of Mathematics
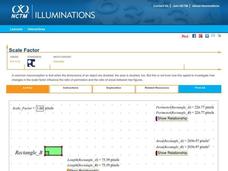
Scale Factor
Does doubling mean everything doubles? Learners adjust the scale factor between two rectangles. Using the calculated measurements, pupils investigate the ratios between the lengths, perimeters, and areas of the rectangles.
CK-12 Foundation
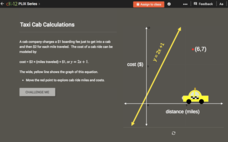
Checking Solutions to Equations: Taxi Cab Calculations
Ride to success in checking solutions to equations. Scholars use an interactive graph to identify points that are solutions to a linear equation. Interpreting these points in terms of the context completes the activity.
Scholastic
Study Jams! Equivalent Fractions
Submarine sandwiches not only taste good, they also make for great math models. Follow along as Zoe explains how to calculate equivalent fractions, while cutting up a sandwich for herself and her friend. She demonstrates the process...
Desmos
Desmos Graphing Calculator
They say a graph is worth a thousand points. The interactive allows users to graph a wide variety of functions and equations. Using the included keyboard or typing directly into the list, learners determine the graph of a function....
Scholastic
Study Jams! Perimeter
Follow this engaging slide show on the calculation of polygon perimeter with some hands-on measurement of perimeters to solidify the concepts. On this webpage there are interactive assessment questions and links to related resources by...
CK-12 Foundation
Volume by Disks: The Vase Case
Finding the volume is an integral characteristic of a vase. Using the idea that summing the areas of cross-sectional disks will calculate the volume of a rotational solid, pupils find the volume of a vase. Scholars determine the interval...
Shodor Education Foundation
Graphit
No graphing calculator? No worries, there's an app for that! Young mathematicians use an app to graph functions. In addition, they can also plot data points.
CK-12 Foundation
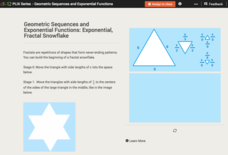
Exponential Growth: Exponential, Fractal Snowflakes
Examine an exponential growth model. Using a fractal, learners calculate the perimeters of each stage. When comparing the consecutive perimeters, a pattern emerges. They use the pattern to build an equation and make conclusions.
CK-12 Foundation
Applications Using Linear Models: Scuba Diving
Dive into this resource on rates of change and linear models. Pupils use two sliders in an interactive to adjust water temperature and depth. They use a given linear equation to calculate the rate of change in water temperature per unit...
Curated OER
Math is Everywhere!
In this everyday math skills pretest, students answer ten multiple choice questions based on their knowledge of everyday math skills such as estimation, addition, and measurement.
Curated OER
Egg Math
In this egg math learning exercise, students click on the links to find out information about eggs and then complete math word problems with that information. Students complete 15 problems.
Shodor Education Foundation
Stem and Leaf Plotter
The key is in the leaves. Pupils enter data to create a stem-and-leaf plot. The resource then displays the plot and calculates the mean, median, and mode of the data. Using the plot and the calculated measures of spread, learners analyze...
CK-12 Foundation
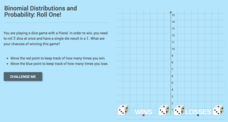
Binomial Distributions and Probability: Roll One!
It takes exactly one to win. Pupils calculate the probability of rolling five dice and having only a single die come up with a one. Learners calculate the number of expected wins out of a series of games. The interactive provides...
CK-12 Foundation
Expected Value: Creating a Discrete Probability Distribution Table
Wanna roll the dice? Determine whether it is a good idea to play a dice game. An interactive presents the rules for a game of dice. Pupils find the probabilities of each event and calculate the expected value of the game. They finish...
CK-12 Foundation
Coefficient of Variation: Diverse Populations
What is the height of school clubs? Learners use sliders to calculate the coefficient of variation for three different school groups. Using the calculations, class members compare the variation in the heights of the groups.
Shodor Education Foundation
Sequencer
Take the first step into graphing sequences. Learners set the starting number, multiplier, add-on, and the number of steps for a sequence. Using the inputs, the interactive calculates and plots the sequence on the coordinate plane. Users...
CK-12 Foundation
Pythagorean Theorem to Determine Distance: Tree Shadows
Why is that shadow getting longer? Determine the changes in the length of a shadow as the sun changes position in the sky. Individuals use an interactive to calculate the length of a shadow at different times during the day via the...
CK-12 Foundation
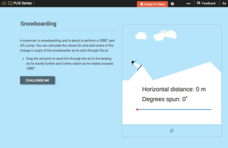
Trigonometric Functions of Angles Greater than 360 Degrees: Snowboarding
Spin through the trigonometric functions. Scholars determine the angle of rotation a snowboarding snowman makes at various distances in his jump. The class members then calculate the values of trigonometric functions for those angles.
CK-12 Foundation
Counting Events: Flipping Unfair Coins
Who said life was fair? An interactive uses an area diagram to represent the probabilities of flipping unfair coins. Pupils use the diagram to calculate the probabilities of outcomes of flipping the two coins. The scholars must decide...
CK-12 Foundation
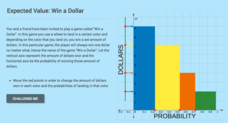
Expected Value: Win a Dollar
Spin a wheel, land on a color ... and win. Learners create a graph to display the probabilities of the amount of money they can win by spinning a colored wheel. The pupils use the dollar amounts and their probabilities to calculate the...
CK-12 Foundation
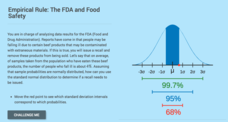
Computing Probabilities for the Standard Normal Distribution: The FDA and Food Safety
To recall or not to recall, that is the question. Using provided data, pupils calculate the percent of people that may fall ill on average. The scholars determine the standard deviation based upon the mean and the empirical rule, then...
Other popular searches
- Calculator Math Games
- Graphing Calculator and Math
- Non Calculator Math
- Graphing Calculator Math
- Calculator Math Free
- Math Using a Calculator
- Activity Calculator Math
- Calculator Math Percentages
- Calculator Math Fractions
- Calculator Math Lessons
- Calculator Math Word Games
- Math Calculator Activities


