Illustrative Mathematics
Building a Quadratic Function Form
A simple tweak in the equation can mean big things for a quadratic graph. High school mathematicians look at the parent graph of a quadratic and incorporate three different changes to the function. The problems require explanations of...
EngageNY
The “WhatPower” Function
The Function That Shall Not Be Named? The eighth installment of a 35-part module uses a WhatPower function to introduce scholars to the concept of a logarithmic function without actually naming the function. Once pupils are...
Mathematics Assessment Project
Functions
Studying function means more than simply learning a formula. Learners must use functions to think through four problems and find solutions. Each task utilizes a different concept from a study of functions. Class members might...
Concord Consortium
Function Project
What if a coordinate plane becomes a slope-intercept plane? What does the graph of a linear function look like? Learners explore these questions by graphing the y-intercept of a linear equation as a function of its slope. The result is a...
Shoreline Community College
Properties of Logarithmic Functions
Use a straightforward approach to understanding logarithmic properties and their role in solving exponential and logarithmic equations to your math class. The lesson begins with an overview of a logarithmic function and its...
Illustrative Mathematics
Distance across the channel
Here you will find a model of a linear relationship between two quantities, the water depth of a channel and the distance across the channel at water level. The cross section of the channel is the shape of an isosceles trapezoid. The...
EngageNY
Modeling a Context from Data (part 2)
Forgive me, I regress. Building upon previous modeling activities, the class examines models using the regression function on a graphing calculator. They use the modeling process to interpret the context and to make predictions...
Illustrative Mathematics
Temperature Conversions
Complete two conversions at once using compositions. Pupils use the conversion formulas for temperatures to calculate a formula to convert directly between Kelvin and Fahrenheit. Classmates determine the meanings of composition...
Noyce Foundation
Ducklings
The class gets their mean and median all in a row with an assessment task that uses a population of ducklings to work with data displays and measures of central tendency. Pupils create a frequency chart and calculate the mean and median....
Inside Mathematics
Picking Apples
Getting the best pick of the apples depends on where to pick. The short assessment presents a situation in which class members must analyze a real-world situation to determine the cost of picking apples. The pricing structures resemble...
Ohio Literacy Resource Center
Solving Systems of Linear Equations Graphing
Do you need to graph lines to see the point? A thorough lesson plan provides comprehensive instruction focused on solving systems of equations by graphing. Resources include guided practice worksheet, skill practice worksheet,...
Virginia Department of Education
Organizing Topic: Data Analysis
Learners engage in six activities to lead them through the process of conducting a thorough analysis of data. Pupils work with calculating standard deviations and z-scores, finding the area under a normal curve, and sampling...
Balanced Assessment
A Sharper Image
Not all continuous functions are differentiable. Pupils find three types of functions that are defined everywhere but not differentiable for all values of x. Along with providing examples of each type of function, learners...
Curated OER
Piecewise Linear Functions: Extending Stories to Graphs
Using this resource, scholars develop graphs that model situations by showing change over time. They answer 15 questions based on information from charts that show growth in weight. They extend the concepts to an assessment section of...
Inside Mathematics
Quadratic (2009)
Functions require an input in order to get an output, which explains why the answer always has at least two parts. After only three multi-part questions, the teacher can analyze pupils' strengths and weaknesses when it comes to...
Curated OER
Continuous Probability Distributions
In this continuous probability distribution worksheet, learners identify discrete and continuous distributions. They calculate the linear combination of the independent normal random variable and determine probabilities using exponential...
Curated OER
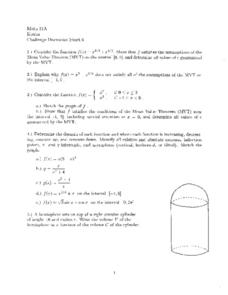
Challenge Discussion Sheet 6
Learners are challenged to determine values that are guaranteed by the mean value theorem. They sketch the graph of a function and show that it satisfies the conditions of the mean value theorem over a given interval. Students determine...
Illustrative Mathematics
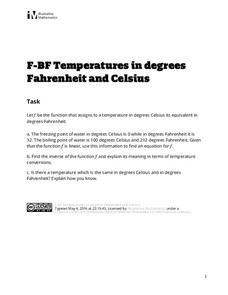
Temperature in Degrees Fahrenheit and Celsius
Scholars develop the conversion formulas between Fahrenheit and Celsius with a task that presents the class with two known temperature equivalents between the two scales. Pupils use those two points to develop the linear conversion...
Curated OER
Data Management and Probability: Applications
In this data management and probability applications worksheet, 8th graders solve 20 various types of probability problems. They find the mean, median, mode and range of various numbers. Then, students use the spinner illustration to...
Willow Tree
Direct and Inverse Variations
Enhance pupil understanding of proportions and variable relationships by studying direct and inverse variation. Use the idea of a proportional relationship to teach direct variation. Then use a similar pattern to help individuals...
Concord Consortium
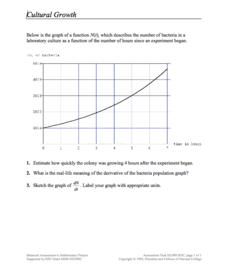
Cultural Growth
Scholars read and interpret a graph relating bacterial growth in a culture over time. They apply knowledge of derivatives, estimation, and graphing to the skill practice questions.
Inside Mathematics
How Old Are They?
Here is a (great) lesson on using parentheses! The task requires the expression of ages using algebraic expressions, including the distributive property. Pupils use their expressions to determine the individual ages.
Inside Mathematics
Party
Thirty at the party won't cost any more than twenty-five. The assessment task provides a scenario for the cost of a party where the initial fee covers a given number of guests. The class determines the cost for specific numbers of guests...
Illustrative Mathematics
Animal Populations
Assume all you know is that the variable Q represents a value that is bigger than the value represented by the variable P. Which is larger P + Q or 2P? The problems in this activity get more complex than...


