CK-12 Foundation
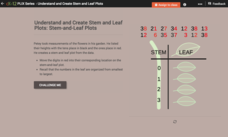
Understand and Create Stem-and-Leaf Plots: Stem-and-Leaf Plots
Explore the advantages to using a stem-and-leaf plot using an online lesson. Learners manipulate an animation to create a stem-and-leaf plot. They then calculate statistics for the data using their display. Guiding questions help them...
CK-12 Foundation
Line Plots from Frequency Tables: Sleep Cycles
Demonstrate the ease of using a frequency table. An interactive lesson allows learners to create a frequency table efficiently. Challenge questions ask your classes to analyze the data represented in the frequency table.
CK-12 Foundation
Two-Sided Stem-and-Lead Plots: Gamers
Which gender spends more time playing video games? Your classes use provided data to answer this question. They first build a two-sided stem-and-leaf plot and then use the display to look for patterns. Guiding questions help them...
CK-12 Foundation
Understand and Create Stem-and-Leaf Plots: Event Survey
A good lesson doesn't just grow on trees! Help your classes understand the concept of a stem-and-leaf plot using an interactive lesson. Learners first create a stem-and-leaf plot from a set of data by dragging the values to the...
CK-12 Foundation
Create and Understand Box-and-Whisker Plots: Babies in a Waiting Room
Explore the strengths and weaknesses of box-and-whisker data display. An interactive lesson asks learners to create a box-and-whisker plot from a set of data. Challenge questions focus on determining what types of conclusions they can...
CK-12 Foundation
Plots of Polar Coordinates: Submarine Sonar
Find the location of enemy submarines with a sonar display that doubles as a polar coordinate system. Pupils find polar coordinates that would be the same location of plotted submarines. They then determine multiple polar...
CK-12 Foundation
Understand and Create Line Graphs: Line Graphs
Explore line graphs and their characteristics through an interactive lesson. Scholars follow a set of directions to plot data on a line graph. They then answer questions about the type of variables, minimum and maximum values, and...
CK-12 Foundation
Stem-and-Leaf Plots and Histograms: Digital Photography
Cameras use histograms to communicate the exposure of a photograph. An interesting lesson uses this idea to help learners deepen their understanding of histograms. It highlights the skew of the graphs by showing under- and overexposed...
CK-12 Foundation
Graphs of Functions Based on Rules: Plotting Profits
Profit from this interactive on graphing and interpreting functions. An interactive allows learners to plot a square root function representing a company's profits. They answer some challenge questions that require interpreting this...
CK-12 Foundation
Displaying Univariate Data: Ordering Leaves
Leaf a little time to organize data. Given data displayed in a stem-and-leaf plot, learners organize the data in a list. Pupils use the data to determine the mode, median, and range of the data set. They determine the benefits of using a...
CK-12 Foundation
Fitting Lines to Data
Scatter the TV sales over weeks. Pupils create a scatter plot to display the number of TV sales over a period of several weeks. The interactive allows class members to create two lines of best fit. Then they determine which line fits...
CK-12 Foundation
Ordered Pairs in Four Quadrants
One quadrant just isn't enough. Pupils learn to plot points in the four quadrants of a coordinate plane using an interactive. A set of challenge questions tests their understanding of the skill.
CK-12 Foundation
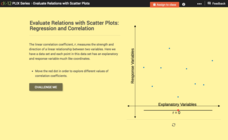
Evaluate Relations with Scatter Plots: Regression and Correlation
Introduce the concept of a correlation coefficient using an interactive lesson. Learners begin by manipulating a correlation coefficient and watching a graph change to represent the new value. Questions help strengthen their...
CK-12 Foundation
Line Graphs to Display Data Over Time: Strawberry Competition
Take the tediousness out of graphing. Using the interactive tool, learners can efficiently create a line graph from a set of data. They then use the graph to answer questions about specific trends in the data.
CK-12 Foundation
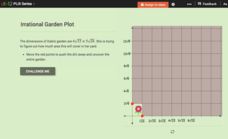
Simplification of Radical Expressions: Irrational Garden Plot
All is not simple in the garden of rationals and irrationals. Learners use a context of a garden to practice simplifying irrational numbers involving radicals. They also find areas of garden with irrational side lengths.
CK-12 Foundation
Mutually Inclusive Events: Flower Beds at the Community Garden
What color does your garden grow? Learners manipulate the number of flowers of two colors in two garden plots. They determine the probabilities of choosing a particular color of a flower in a given plot. Scholars find the relationship of...
CK-12 Foundation
Least-Squares Regression
Residual plots let you find the perfect line of best fit. As users adjust the points on a scatter plot and a possible line of best fit, the interactive automatically changes the residual plot. This change allows them to see connections...
CK-12 Foundation
Rectangular to Polar Form for Equations: Polar Coordinates
Plot points around a wheel. Pupils use an interactive tool to plot a point using polar coordinates with the aid of a wheel. Scholars use the interactive to answer five questions to finish the lesson. The resource provides background...
CK-12 Foundation
Determining the Equation of a Line: Temperature Conversion Challenge
Line up the temperature conversions. Pupils create the linear function between Celsius and Fahrenheit on a graph by plotting the freezing and boiling points of water. The scholars determine how the relationship changes based upon...
CK-12 Foundation
Vectors as Directed Line Segments: Directed Line Segment
Direct your class' attention to directed line segments. The interactive resource allows pupils to create segments with specific endpoints. Scholars plot the initial and terminal points to determine the direction and magnitude of the...
CK-12 Foundation
Graphs in the Coordinate Plane: Functions on a Cartesian Plane
Connect the dots to graph a linear function. Young mathematicians use an interactive to first plot provided points on a coordinate plane. They connect these points with a line and then answer questions about the slope and y-intercept of...
CK-12 Foundation
Function Rules based on Graphs: Making Money in the Hat Business
Hats off to those learning about the graphs of functions. Individuals use an interactive to plot points representing profits for a hat business. They identify a quadratic equation to represent this function and answer challenge questions...
CK-12 Foundation
Polygon Classification in the Coordinate Plane
Classify this resource into the "Use" pile. Scholars use an interactive coordinate plane to plot polygons given coordinates for the vertices. They use properties to classify each polygon and answer a few challenge questions regarding the...
CK-12 Foundation
Order Real Numbers: Pie Baking Contest
Time is on your side. Scholars plot three points on number lines with different time units to represent the time it takes three people to bake pies. They determine the fastest baker and the difference in times between the bakers.


