EngageNY
Interpreting the Graph of a Function
Groups sort through NASA data provided in a graphic to create a graph using uniform units and intervals. Individuals then make connections to the increasing, decreasing, and constant intervals of the graph and relate these connections...
Virginia Department of Education
Radical Equations
Provide students with the skill for how to examine algebraic and graphical approaches to solving radical equations. Learners solve various radical equations involving square root and cube root expressions. They first solve using...
West Contra Costa Unified School District
Matching Quadratic Functions
Ever sigh when learners ask why they have to know so many different forms of the quadratic equation? Here is a lesson that comes in handy! Using hands-on matching activities, quadratic equations are explored through their graphical...
EngageNY
Graphing Systems of Equations
Expand on learners' understanding of quadratic-linear systems. Building on the graphic understanding developed in the previous lesson, pupils learn algebraic methods of solving the systems.
EngageNY
Vectors in the Coordinate Plane
Examine the meaning and purpose of vectors. Use the lesson to teach your classes how find the magnitude of a vector and what it represents graphically. Your pupils will also combine vectors to find a resultant vector and interpret its...
Mathed Up!
Solving Simultaneous Equations Graphically
The solution resides at the intersection. Pupils use a short instructional activity to review the process of solving a system of linear equations using graphing. The instructional activity provides completed graphs for most of the items,...
Curated OER
Math Graphic Organizer
In this graphic organizer worksheet, 4th graders use the divided graphic organizer to help them enhance heir addition, subtraction, division, and multiplication skills.
Mathematics Assessment Project
Representing Inequalities Graphically
A new, improved version of the game Battleship? Learners graph linear inequalities on the coordinate plane, then participate in a game where they have to guess coordinate points based on the solution to a system of linear inequalities in...
Curated OER
Introduction to Graphical and Algebraic Inverses
Solve inverse functions through graphing and algebra. High schoolers will graph inverse functions and use the correct notation to write the equation. They observe a graph and write an equation for the function. In the end, they will be...
Curated OER
Using Graphical Displays to Depict Health Trends in America's Youth
Identify the different types of graphs and when they are used. Learners will research a specific health issue facing teens today. They then develop a survey, collect and analyze data and present their findings in class. This is a...
EngageNY
Describing Center, Variability, and Shape of a Data Distribution from a Graphical Representation
What is the typical length of a yellow perch? Pupils analyze a histogram of lengths for a sample of yellow perch from the Great Lakes. They determine which measures of center and variability are best to use based upon the shape of the...
EngageNY
Directed Line Segments and Vectors
Investigate the components of vectors and vector addition through geometric representations. Pupils learn the parallelogram rule for adding vectors and demonstrate their understanding graphically. They utilize the correct notation and...
Willow Tree
Functions
What makes a function a function? Learn the criteria for a relation defined as a function both numerically and graphically. Once young mathematicians define a function, they use function notation to evaluate it.
EngageNY
Bacteria and Exponential Growth
It's scary how fast bacteria can grow — exponentially. Class members solve exponential equations, including those modeling bacteria and population growth. Lesson emphasizes numerical approaches rather than graphical or algebraic.
Mathematics Vision Project
Module 1: Functions and Their Inverses
Nothing better than the original! Help your class understand the relationship of an inverse function to its original function. Learners study the connection between the original function and its inverse through algebraic properties,...
EngageNY
Projecting a 3-D Object onto a 2-D Plane
Teach how graphic designers can use mathematics to represent three-dimensional movement on a two-dimensional television surface. Pupils use matrices, vectors, and transformations to model rotational movement. Their exploration involves...
Balanced Assessment
Toilet Graph
Mathematics can model just about anything—so why not simulate the height of water in a toilet bowl? The lesson asks pupils to create a graphical model to describe the relationship of the height of the water as it empties and fills again....
CK-12 Foundation
The Real Numbers: Number System
Get real about learning the real number classification. Young mathematicians create a graphic organizer of the real number system using an interactive. They answer a set of challenge questions on the classifications of real numbers.
CK-12 Foundation
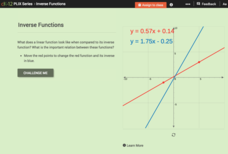
Inverse Functions
Provide a graphical view of inverses. Pupils manipulate points on a line and see the relationship of the graph with the graph of its inverse. Using the relationship between the graphs, scholars respond to questions concerning inverses...
CK-12 Foundation
Limit of a Sequence: Finding the Limit of a Sequence (Part 4)
Take a look at another alternating sequence. The resource provides a graphical display of a sequence that alternates between two values. Pupils use the display to determine whether the sequence has a limit. Given a theory of limit,...
K20 LEARN
Family Ties: Exploring Families OF Functions
They say it runs in the family. Small groups use a card sorting activity to group graphs of functions into families. After grouping by families, the class develops conclusions for parent functions and create a graphic organizer.
Mathematics Vision Project
Module 4: Polynomial Functions
Bridge the gap between graphical and algebraic representations. Learners complete six lessons that begin by pointing out connections between the key features of a polynomial graph and its algebraic function. Later, pupils use the...
Curated OER
Solving Systems of Linear Equations Graphically
Students solve systems of equations graphically. In this algebra lesson, students find the point of intersection of two lines if they are not parallel. They rewrite the equation in the y=mx + b form and graph using slope and intercept.
Curated OER
Linear Systems: Graphical Interpretation of Vectors
In this graphical interpretation of vectors worksheet, students execute operations of addition and multiplication by a scalar. They sketch results and determine the commutativity of vector addition. This three-page worksheet contains...
Other popular searches
- Graphic Organizers
- Graphic Design
- Biography Graphic Organizer
- Main Idea Graphic Organizers
- Vocabulary Graphic Organizer
- Story Map Graphic Organizer
- Graphic Aids
- Science Graphic Organizers
- Setting Graphic Organizer
- Math Graphic Organizers
- 4 Square Graphic Organizer
- Sample Graphic Organizers


