Curated OER
Functions and Graphs, Section 1.2
In this function worksheet, students determine if a list of given relations is a function. They evaluate functions, examine graphs of functions, and find the domain and range of the represented function. Students solve 12 function...
Curated OER
Finding the Limit: Piecewise Functions and Graphs
This pre-calculus worksheet is short, yet challenging. High schoolers calculate the limit of piecewise functions, rational functions, and graphs as x approaches a number from the positive or negative side. There are four questions.
Curated OER
Exercise Set 2.7: Functions and Graphs
In this functions worksheet, students solve 40 short answer problems. Students determine if a graph represents a function. Students find the domain of absolute value and square root functions.
Curated OER
Lesson 2-5: Absolute Value Functions and Graphs
What is absolute value? What is an absolute value function? Emerging mathematicians solve equations containing variables inside an absolute value sign. They graph each function on a coordinate plane and identify the maximum and minimum...
Curated OER
Graphs: Linear Functions
In this linear function instructional activity, students use tables to find the values of functions. They graph linear functions and explore the significance of the coordinates. This two-page instructional activity contains 4 multi-step...
Curated OER
Sets, Relations, and Functions
Sets, relations, functions, and graphing linear equations are practiced in this challenging learning exercise. The class determines if a relation is a function or not and find the functional value of a domain element. The one page...
Mathed Up!
Straight Line Graphs
Develop graphs by following the pattern. The resource provides opportunities for reviewing graphing linear equations. Pupils create tables to graph linear equations by using patterns whenever possible. The worksheet and video are part of...
Curated OER
Linear Functions: Slope, Graphs, and Models
This math packet provides an opportunity for learners to graph two linear equations on a coordinate grid and determine the slope and y-intercept of each. They use the equation of five lines to find the slope and y-intercepts, and then...
Charleston School District
Graphs of Linear Functions
What does a slope of 2/3 mean? Develop an understanding of the key features of a linear function. Pupils graph the linear functions and explain the meaning of the slope and intercepts of the graphs.
Charleston School District
Graphing Functions
How do letters and numbers create a picture? Scholars learn to create input/output tables to graph functions. They graph both linear and nonlinear functions by creating tables and plotting points.
Curated OER
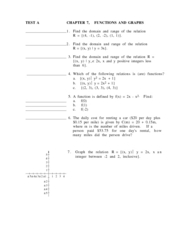
Chapter 7. Functions and Graphs
In this functions and graphs worksheet, students determine the domain and range of a given relation. They graph functions on a coordinate plane and write equations in the slope-intercept form. This twelve page worksheet contains 30...
Curated OER
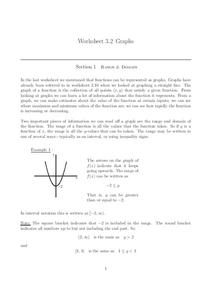
Graphs
In this graphs worksheet, learners solve and complete 15 various types of problems. First, they determine the range of the function of the graph shown and write in interval notation. Then, students find the domain of the function in the...
Houghton Mifflin Harcourt
Graphs from Patterns
Fifth graders analyze patterns and begin looking at function tables. This is a pertinent preparation for graphing patterns. In fact, consider giving your class a piece of graph paper and then teach them how!
Curated OER
Instantaneous Rate of Change of a Function
Pupils draw the graph of a door opening and closing over time. They graph a given function on their calculators, create a table of values and interpret the results by telling if the door is opening or closing and evaluate the average...
Illustrative Mathematics
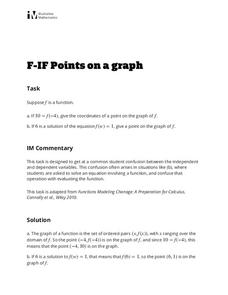
Points on a Graph
Learners practice using their knowledge of how to interpret a function and use function notation. The activity includes two questions. Given an input of a function and its output, the first question asks learners to write the ordered...
Flipped Math
Unit 10 Review: Graphing Sine and Cosine
Go up and down with a review. Learners review finding the amplitude, midline, period, and frequency of sinusoidal functions and use that information to draw graphs. Pupils arrive at equations for function from graphs. They finish up the...
Mathed Up!
Drawing Quadratic Graphs
Curve through the points. The resource, created as a review for the General Certificate of Secondary Education Math test, gives scholars the opportunity to refresh their quadratic graphing skills. Pupils fill out function tables to find...
Illustrative Mathematics
Function Rules
Function machines are a great way to introduce the topic of functions to your class. Here, you will explore the input and output to functions both using numerical and non-numerical data. Learners are encouraged to play with different...
Flipped Math
Modeling with Graphs
Create a graph for anything in the world. Pupils continue to work with graphs that model situations. The learners analyze different graphs to answer questions about the scenario along with finding equations of graphs. Scholars use...
Inside Mathematics
Sorting Functions
Graph A goes with equation C, but table B. The short assessment task requires class members to match graphs with their corresponding tables, equations, and verbalized rules. Pupils then provide explanations on the process they used to...
EngageNY
Revisiting the Graphs of the Trigonometric Functions
Use the graphs of the trigonometric functions to set the stage to inverse functions. The lesson reviews the graphs of the basic trigonometric functions and their transformations. Pupils use their knowledge of graphing functions to model...
Illustrative Mathematics
Building a Quadratic Function Form
A simple tweak in the equation can mean big things for a quadratic graph. High school mathematicians look at the parent graph of a quadratic and incorporate three different changes to the function. The problems require explanations of...
Flipped Math
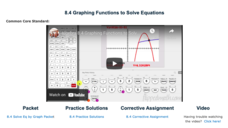
Graphing Functions to Solve Equations
Intersections become solutions. Scholars watch a video on using a graphing calculator to find the solution to an equation in one variable. While watching the presentation, pupils practice working some of the examples and compare their...
Flipped Math
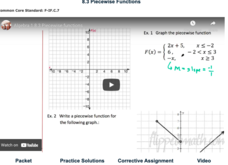
Piecewise Functions
Break it up into pieces to solve the problem. Individuals watch a video on how to graph and determine the equation and values of piecewise functions. Viewers then work several exercises to practice evaluating a piecewise function at...
Other popular searches
- Graphing Functions
- Graphing Quadratic Functions
- Graphing Rational Functions
- Graphing Linear Functions
- Graphing Parent Functions
- Graphing Exponential Functions
- Graphing Piecewise Functions
- Graphing Polynomial Functions
- Graphing Nonlinear Functions
- Graphing Cubic Functions
- Graphing Radical Functions
- Algebra Graphing Functions


