Illustrative Mathematics
Building a Quadratic Function Form
A simple tweak in the equation can mean big things for a quadratic graph. High school mathematicians look at the parent graph of a quadratic and incorporate three different changes to the function. The problems require explanations of...
Mathematics Assessment Project
Functions
Studying function means more than simply learning a formula. Learners must use functions to think through four problems and find solutions. Each task utilizes a different concept from a study of functions. Class members might...
Concord Consortium
Function Project
What if a coordinate plane becomes a slope-intercept plane? What does the graph of a linear function look like? Learners explore these questions by graphing the y-intercept of a linear equation as a function of its slope. The result is a...
Curated OER
Yam in the Oven
Your vegetable eaters will practice function notation statement interpretation in this short task. These few exercises will bring out misconceptions students may have about function notation as well.
Illustrative Mathematics
Distance across the channel
Here you will find a model of a linear relationship between two quantities, the water depth of a channel and the distance across the channel at water level. The cross section of the channel is the shape of an isosceles trapezoid. The...
EngageNY
Modeling a Context from Data (part 2)
Forgive me, I regress. Building upon previous modeling activities, the class examines models using the regression function on a graphing calculator. They use the modeling process to interpret the context and to make predictions...
Illustrative Mathematics
Temperature Conversions
Complete two conversions at once using compositions. Pupils use the conversion formulas for temperatures to calculate a formula to convert directly between Kelvin and Fahrenheit. Classmates determine the meanings of composition...
Noyce Foundation
Ducklings
The class gets their mean and median all in a row with an assessment task that uses a population of ducklings to work with data displays and measures of central tendency. Pupils create a frequency chart and calculate the mean and median....
Inside Mathematics
Picking Apples
Getting the best pick of the apples depends on where to pick. The short assessment presents a situation in which class members must analyze a real-world situation to determine the cost of picking apples. The pricing structures resemble...
Balanced Assessment
A Sharper Image
Not all continuous functions are differentiable. Pupils find three types of functions that are defined everywhere but not differentiable for all values of x. Along with providing examples of each type of function, students...
Curated OER
Rising Gas Prices – Compounding and Inflation
Financial literacy skills and exponential models are connected by the compound interest formula in this task centered on inflation calculations. Collaborative learners get experience collecting data from the given websites and exploring...
Curated OER
Population and Food Supply
What does it mean for something to grow exponentially, and how does that compare to linear growth? This activity tries to help learners gain an understanding of these concepts while modeling real-world problems. Linear and exponential...
Inside Mathematics
Quadratic (2009)
Functions require an input in order to get an output, which explains why the answer always has at least two parts. After only three multi-part questions, the teacher can analyze pupils' strengths and weaknesses when it comes to...
Illustrative Mathematics
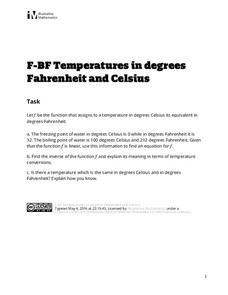
Temperature in Degrees Fahrenheit and Celsius
Scholars develop the conversion formulas between Fahrenheit and Celsius with a task that presents the class with two known temperature equivalents between the two scales. Pupils use those two points to develop the linear conversion...
Illustrative Mathematics
Velocity vs. Distance
At the end of this activity, your number crunchers will have a better understanding as to how to describe graphs of velocity versus time and distance versus time. It is easy for learners to misinterpret graphs of velocity, so have them...
Concord Consortium
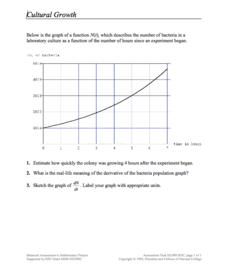
Cultural Growth
Scholars read and interpret a graph relating bacterial growth in a culture over time. They apply knowledge of derivatives, estimation, and graphing to the skill practice questions.
Inside Mathematics
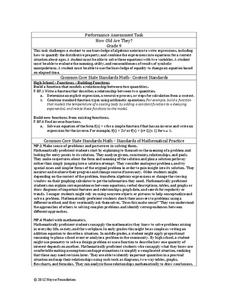
How Old Are They?
Here is a (great) lesson on using parentheses! The task requires the expression of ages using algebraic expressions, including the distributive property. Pupils use their expressions to determine the individual ages.
Inside Mathematics
Party
Thirty at the party won't cost any more than twenty-five. The assessment task provides a scenario for the cost of a party where the initial fee covers a given number of guests. The class determines the cost for specific numbers of guests...
Curated OER
The Random Walk
Deep mathematical thinking is found with just a coin and a number line. Combining computing some probabilities in a discrete situation, and the interpretation of a function, this simple task gives learners a lot to think about on...
Illustrative Mathematics
Animal Populations
Assume all you know is that the variable Q represents a value that is bigger than the value represented by the variable P. Which is larger P + Q or 2P? The problems in this activity get more complex than...
Illustrative Mathematics
The Sign of Solutions
Positive or negative, zero or no solution, are all possibilities for the solution of a linear equation. Here the resource gives examples of linear equations in one variable and their type of solutions. The resource comes with commentary...
EngageNY
From Ratio Tables, Equations and Double Number Line Diagrams to Plots on the Coordinate Plane
Represent ratios using a variety of methods. Classmates combine the representations of ratios previously learned with the coordinate plane. Using ratio tables, equations, double number lines, and ordered pairs to represent...
Illustrative Mathematics
Downhill
A car traveling down a steep hill is the model for this resource. The confusion comes when the elevation, E, is given in terms of distance, d. The distance, d, is the horizontal distance from E. Therefore, the equation, E = 7500 – 250d,...
Inside Mathematics
Conference Tables
Pupils analyze a pattern of conference tables to determine the number of tables needed and the number of people that can be seated for a given size. Individuals develop general formulas for the two growing number patterns and...


