Virginia Department of Education
The Real Meal Deal
Burgers and salads and sodas, oh my! Scholars use a menu to investigate the Fundamental Counting Principle. They create tree diagrams to illustrate the number of possible choices for each given scenario.
Curated OER
The Colored Cube Question
Fourth graders examine how to determine the probabilities or likelihood of outcomes. They complete trials to determine probability while using different manipulatives. They determine how games can be made fair or unfair in this unit of...
College Board
2006 AP® Statistics Free-Response Questions Form B
Test a significant review of statistical questions. The resource provides pupils and teachers with insight into the way the exam assesses statistical concepts. Half of the released questions from the 2006 AP® Statistics Form B questions...
College Board
2007 AP® Statistics Free-Response Questions Form B
So that is how they do it! Pupils and teachers see how College Board assesses topics using the free-response questions from Form B of the 2007 AP® Statistics test. The six questions are divided in two sections, the first five being more...
Curated OER
Flicking Football Fun
Young mathematicians fold and flick their way to a deeper understanding of statistics with a fun, hands-on math unit. Over the course of four lessons, students use paper footballs to generate data as they learn how to create line...
College Board
2004 AP® Statistics Free-Response Questions
Provide some practice showing the work. Pupils work through six free-response questions that require them to show their work. They use their knowledge of statistics to develop solutions to problems within context. Scenarios range from...
College Board
2001 AP® Statistics Free-Response Questions
Develop a complete understanding of the course. Pupils and teachers use the six free-response questions to gather information about aspects of the AP® Statistics course. The resource and test section show how items cover the content. A...
College Board
2002 AP® Statistics Free-Response Questions
Statistically, prepared classes perform better. Teachers and pupils use the released 2002 AP® Statistics Free-Response questions to gain an understanding of how questions may be worded on the exam. Resources request that teachers put an...
College Board
2003 AP® Statistics Free-Response Questions
Hypothetically, knowing the structure of a test should help. Pupils use the released free-response questions from the 2003 AP® Statistics exam to become aware of the structure of questions on the test. Half the questions in the set...
College Board
1999 AP® Statistics Free-Response Questions
Closer to 2010 than expected. Several of the 1999 AP® Statistics free-response questions align to Common Core standards. Items ask pupils to analyze residuals, two-way tables, and calculate expected values to determine the fairness of a...
College Board
2004 AP® Statistics Free-Response Questions Form B
Over the years, data analysis has been important. Looking back to the 2004 AP® Statistics Form B free-response questions, pupils and teachers see the importance of analysis of data sets. The six questions contain analysis of data on...
Curated OER
Take A Chance Or Two
A two-part lesson immerses young statisticians in the concept of probability. On the first day, will conduct experiments with a two-colored coin and learn how to write probabilities as fractions, ratios, and percentages. In the second...
Curated OER
Efficiency Means Getting More for Less
Students measure water and make predictions about efficiency.
Curated OER
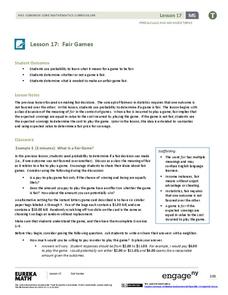
Fair Games
Fifth graders examine the statistics of playing games. Many games of chance and activities in maths text books involve rolling two dice and combining the scores, usually by addition. Students often find the probabilities of such events...
Curated OER
Grade 5: Alphabet Frequency
Fifth graders collect and organize data from writing samples, use fractions and decimals to describe the experimental data, and use the experimental results to make predictions about the frequency of letter usage in the English language.
Curated OER
Make the Highest Total
Sixth graders predict the outcome of a simple probability experiment, test it and explain the result by using problem solving strategies to explore situations mathematically. They then play a few games informally where students play in...
Curated OER
R-Project
Young scholars analyze the outcome of a scientific experiment using free downloadable software. They collect experimental data to use statistical software to determine if the observations are likely due to the treatment or random chance.
Curated OER
M&M Exponential Activity
Students create a scatter plot of their experimental data. In this algebra lesson, students use M&M's to determine an algebraic model. They discuss results in class.
Curated OER
Houses
Third graders use a number of problem solving strategies in this unit of lessons. They determine how to draw and model three-dimensional objects, use co-ordinate systems, determine probability of events, and identify paths of simple...
Curated OER
Spinning Nickels
Students make predictions to figure out the probability of a spun nickel landing on either heads or tails. They test their predictions through experimentation. They create a graph showing the frequency for the number of heads.
Curated OER
Disease and Epidemics
Explore how the study of diseases and epidemics can be comprehended from a mathematical perspective. Investigate finite geometric series, calculating threshold values, and statistical models of the spread of disease. How many makes it an...
Curated OER
The Bell Curve
Learners are introduced to the concepts of the normal curve, skewness and the standard deviation. They discuss how the normal distribution has been used and misused to support conclusions.
Mathematics Vision Project
Geometric Figures
Logical thinking is at the forefront of this jam-packed lesson, with young mathematicians not only investigating geometric concepts but also how they "know what they know". Through each activity and worksheet, learners wrestle with...
Illustrative Mathematics
Accuracy of Carbon 14 Dating II
The scientific issue of carbon-14 dating and exponential decay gets a statistics-based treatment in this problem. The class starts with a basic investigation of carbon content, but then branches out to questions of accuracy and ranges of...


