Balanced Assessment
Multi-Graphs
So many things change as time goes by. Here, scholars create graphs based on this premise. Each problem asks pupils to sketch a graph that describes a given situation. Their graphs represent various characteristics such as height,...
Willow Tree
Graphing
So many methods and so little time! The efficient method of graphing a linear equation depends on what information the problem gives. Pupils learn three different methods of graphing linear equations. They graph equations using...
Kid Zone
Groundhog's Day Graphing
This Groundhog's Day, challenge scholars to predict, estimate, tally, and graph in a weather-themed lesson in which class members play the role of the groundhog to forecast the weather come February second.
CK-12 Foundation
Single Bar Graphs: Cupcakes
What is a little cake among friends? Given the relationship between the number of cupcakes five friends have, pupils create a bar graph. The learners answer questions about the graph and adjust the graph if one friend shares some of his...
CK-12 Foundation
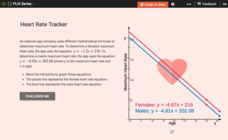
Graphs of Linear Systems: Heart Rate Tracker
Max out heart rates for males and females. Formulas of maximum heart rates provide the equations for a linear system. Pupils use the interactive to graph the equations for males and females and determine their points of intersection. The...
BW Walch
Creating and Graphing Exponential Equations
Frequently found in biology and economic application problems, exponential equations show up as stars in this introductory presentation. Taking no background or knowledge of exponentials for granted, the slides walk learners through the...
Curated OER
Bar Graphs and Line Graphs
In this bar graphs and line graphs worksheet, students examine given data, organize it, and create bar graphs and line graphs from the given information. They interpret graphs and write statements explaining the graph. This one page...
K-5 Math Teaching Resources
Blank Bar Graph Template
This template is just begging for your young mathematicians to fill it in with colorful bar graphs! With horizontal and vertical axes in place and grid lines for added support, this is a great resource for teaching children how to...
Mathed Up!
Straight Line Graphs
Develop graphs by following the pattern. The resource provides opportunities for reviewing graphing linear equations. Pupils create tables to graph linear equations by using patterns whenever possible. The worksheet and video are part of...
Curated OER
Open-Ended Problem Solving - Math
If you are looking for an end-of-the-year math assessment, then this instructional activity could be for you! Your mathematicians are assessed on their ability to solve difficult, multi-step word problems that take quite a bit of thought...
US Department of Commerce
Looking at Numbers of Births Using a Line Graph
Was there a baby boom? Using census data, class members take a look at the number of 8-11 year olds and determine their birth years. Scholars create a double line graph to compare the number of births for two states for several years....
Virginia Department of Education
Graphing Linear Equations
Combine linear equations and a little creativity to produce a work of art. Math scholars create a design as they graph a list of linear equations. Their project results in a stained glass window pattern that they color.
Virginia Department of Education
Graphs
Examine different types of graphs as a means for analyzing data. Math scholars identify the type of graph from a series of data displays and then develop questions to match each one. Then, given a scatter plot of height versus age data,...
Inside Mathematics
Vencent's Graphs
I like algebra, but graphing is where I draw the line! Worksheet includes three multiple-part questions on interpreting and drawing line graphs. It focuses on the abstract where neither axis has numbers written in, though both are...
EngageNY
Graphs of Simple Nonlinear Functions
Time to move on to nonlinear functions. Scholars create input/output tables and use these to graph simple nonlinear functions. They calculate rates of change to distinguish between linear and nonlinear functions.
Kenan Fellows
Reading Airline Maintenance Graphs
Airline mechanics must be precise, or the consequences could be deadly. Their target ranges alter with changes in temperature and pressure. When preparing an airplane for flight, you must read a maintenance graph. The second lesson of...
Math Worksheets Land
Pie or Circle Graphs - Guided Lesson
A guided lesson worksheet reinforces pie graph skills using a given set of data. Each problem requires young mathematicians to create a circle graph using five colors, and to provide a key that goes along with the graph.
EngageNY
Every Line is a Graph of a Linear Equation
Challenge the class to determine the equation of a line. The 21st part in a 33-part series begins with a proof that every line is a graph of a linear equation. Pupils use that information to find the slope-intercept form of the equation...
Virginia Department of Education
Transformational Graphing
Find relationships between the structure of a function and its graph. An engaging lesson explores seven parent functions and their graphs. Learners match functions to their graphs and describe transformations.
EngageNY
The Line Joining Two Distinct Points of the Graph y=mx+b Has Slope m
Investigate the relationship between the slope-intercept form and the slope of the graph. The lesson plan leads an investigation of the slope-intercept equation of a line and its slope. Pupils realize the slope is the same as the...
CK-12 Foundation
Line Graphs to Display Data Over Time: Strawberry Competition
Take the tediousness out of graphing. Using the interactive tool, learners can efficiently create a line graph from a set of data. They then use the graph to answer questions about specific trends in the data.
Flipped Math
Modeling with Graphs
Create a graph for anything in the world. Pupils continue to work with graphs that model situations. The learners analyze different graphs to answer questions about the scenario along with finding equations of graphs. Scholars use...
CK-12 Foundation
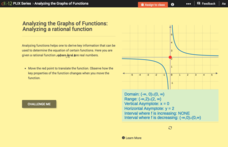
Analyzing the Graphs of Functions: Analyzing a Rational Function
Shift the function and transform the key features of the graph. By translating the graph of the rational function, class members find out how the key features alter. Pupils determine the domain, range, asymptotes, and intervals of...
Corbett Maths
Transformations of Graphs
Geometric transformations in algebra ... what? Given four transformations, the narrator explains how each affect the graph of the original function. The transformations involve translations and reflections, both horizontally and...


