Inside Mathematics
Sorting Functions
Graph A goes with equation C, but table B. The short assessment task requires class members to match graphs with their corresponding tables, equations, and verbalized rules. Pupils then provide explanations on the process they used to...
Charleston School District
Graphs of Linear Functions
What does a slope of 2/3 mean? Develop an understanding of the key features of a linear function. Pupils graph the linear functions and explain the meaning of the slope and intercepts of the graphs.
Illustrative Mathematics
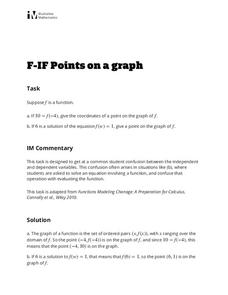
Points on a Graph
Learners practice using their knowledge of how to interpret a function and use function notation. The activity includes two questions. Given an input of a function and its output, the first question asks learners to write the ordered...
West Contra Costa Unified School District
Introduction to Inverse Functions
Ready to share the beauty of the inverse function with your classes? This algebra II lesson guides the discovery of an inverse function through a numerical, graphical, and an algebraic approach. Connections are made between the three,...
Flipped Math
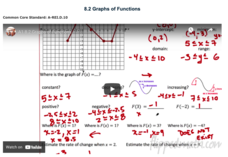
Graphs of Functions
Create a graphical description. Pupils watch a video presentation starting with vocabulary on properties of a graph of a function and then use the vocabulary to find key features of graphs of a function. Scholars use three graphs in the...
Illustrative Mathematics
Function Rules
Function machines are a great way to introduce the topic of functions to your class. Here, you will explore the input and output to functions both using numerical and non-numerical data. Learners are encouraged to play with different...
Curated OER
Graphing Functions
In this graphing functions worksheet, 11th graders solve and complete 10 different types of problems. First, they graph each function and list the asymptote, domain and range for each. Then, students sketch each graph. They also draw and...
Curated OER
Graphing Functions
In this graphing functions worksheet, students write functions in logarithmic and exponential forms. They evaluate logarithms and determine the inverse of a function. Students graph functions. This six-page worksheet contains 20...
Curated OER
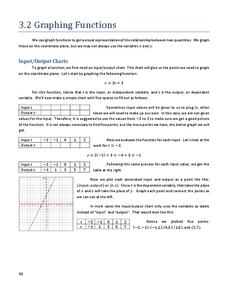
Tables and xy-Coordinates
Use this graphing functions worksheet to have learners complete four tables and graph the results on the included coordinate grid.
Curated OER
Exponential Graph Functions
In this exponential functions worksheet, high schoolers solve and complete 13 various types of problems. First, they define what is different and what is the same about exponential and linear functions. Then, students write a rule for...
Illustrative Mathematics
Identifying Quadratic Functions (Vertex Form)
Pupils calculate the equation of a quadratic in vertex form from a specific graph and determine an equation that would fit the description of a parabola. The final question determines the individuals' understanding of the signs of the...
West Contra Costa Unified School District
Key Features of Graphs
The key is ... After a day of instruction on key features of graphs, groups create a poster and presentation on the key features of their given function graph. The resource provides an extension activity of "telephone" using graphs.
Charleston School District
Pre-Test Unit 3: Functions
How does an input affect an output? Assess your learners' ability to answer this question using this pre-test. Scholars answer questions about the basics of a function. Topics include determining if a table or statement represents a...
CPALMS
Writing an Exponential Function from its Graph
Grow an equation for the exponential graph. Given a graph of an exponential function, class members write the equation of the function provided. The graph labels two points on the graph: the y-intercept and the point where x is one.
Concord Consortium
Functions by the Slice
Piece by piece ... dismantling a function can highlight interesting patterns. The task asks learners to slice functions in sections with the same vertical change. They then recreate the graph with these slices positioned horizontally....
West Contra Costa Unified School District
Connecting Graphing and Solving Absolute Value Equations and Functions
Can you solve an equation graphically? Absolutely! This Algebra II lesson makes the connection between solving an absolute value equation and graphing two functions. Graphing absolute value functions is presented through the process of...
Concord Consortium
Rational and Not So Rational Functions
Do not cross the line while graphing. Provided with several coordinate axes along with asymptotes, pupils determine two functions that will fit the given restrictions. Scholars then determine other geometrical relationships of asymptotes...
Virginia Department of Education
Functions 1
Scholars learn what it means for a relation to be a function and see various representations of functions. After learning the definition, they participate in a card sorting activity classifying relations as functions or not.
Inside Mathematics
Graphs (2004)
Show your pupils that perimeter is linear and area is quadratic in nature with a short assessment task that requests learners to connect the graph and equation to a description about perimeter or area. Scholars then provide a...
Curated OER
Graphing Exponential Functions
Explore the concept of graphing exponential functions. High school mathematicians are given exponential functions such as y=2*3^x, and they graph them on a coordinate plane. They are given two exponential graphs and must write an...
Houston Area Calculus Teachers
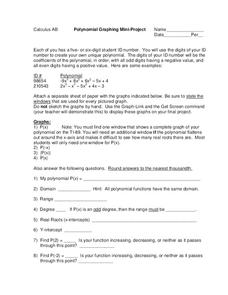
Polynomial Graphing
Your AP Calculus learners probably have their ID numbers memorized, but have they tried graphing them? Pique your pupils' interest by asking each to create a unique polynomial function based on their ID numbers, and then analyze the...
West Contra Costa Unified School District
Using Derivatives to Graph Polynomials
You can learn to graph as well as a calculator using calculus. The lesson introduces using derivatives to find critical points needed to graph polynomials. Pupils learn to find local maximums and minimums and intervals of increase and...
Curated OER
Graph, Identify Asymptotes, Find Domain and Range, for Eleven Simple Rational Functions
Using this worksheet, pupils graph 11 simple rational functions. They also find asymptotes, domain, and range for each function. The solutions are provided.
Illustrative Mathematics
Graphing Rational Functions
The slider feature on Desmos excellently shows how graphs change based on different variable values. Learners look at two similar rational functions and compare and discuss what happens when the numbers go from positive to zero to...
Other popular searches
- Algebra Graphing Functions
- Exploring Graphing Functions
- Graphing Nonlinear Equations
- Functions and Graphing


