Shodor Education Foundation
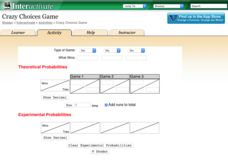
Crazy Choices Game
Wanna take a chance on which game is best? The resource provides three games of chance using multiple types of games. Games range from coin toss to cards. Choosing a type of game, pupils determine what wins and enter the theoretical...
Shodor Education Foundation
Buffon's Needle
Find the needle on a lined paper. Pupils run a simulation of dropping a needle on a lined paper. The probability of the needle crossing at least one line is pi/2. After each trial, the interactive displays the approximation of pi based...
Shodor Education Foundation
Racing Game with One Die
Pupils roll a die to figure out which car advances on a race track. They determine the rules for each car moving forward and, given the statistics of the winner, compare if it matches their predictions.
Shodor Education Foundation
Experimental Probability
Spin into a dicey experiment. Pupils use a spinner or a pair of dice to determine the experimental probabilities of each outcome. The interactive allows for either, one, five, or ten consecutive experiments. Using the applet, learners...
Shodor Education Foundation
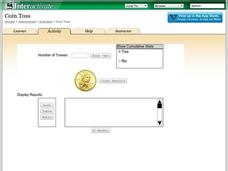
Coin Toss
Are your young mathematicians having a hard time making heads or tails of probabilities? It's no toss up—here is a resource that's sure to straighten them out! Learners run the interactive to toss a coin a different number of times....
Shodor Education Foundation
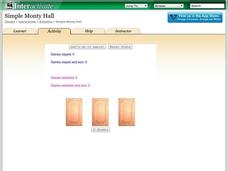
Simple Monty Hall
What's behind door number one? A fun resource lets learners simulate the classic Monty Hall probability problem. Pupils choose a door, and after they select a losing door, they decide whether to switch or stay. Using their decisions, the...
Beyond Benign
In Your Bathroom
How toxic is your shampoo? The 20th instructional activity of the chemistry series of 24 examines the ingredients in common shampoos. Learners tally the number of toxic ingredients and create graphical representations to communicate...
Beyond Benign
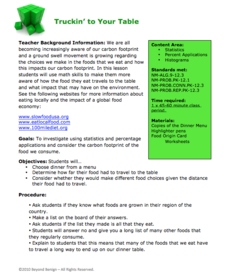
Truckin’ to Your Table
Food takes a trip to the table. Class members choose a meal from a menu and calculate the total cost of the meal including tax and tip. Using a food origin card, pupils determine how far each of the ingredients of a meal traveled to end...
Education World
Predicting Pumpkins
If you want more pumpkin seeds, you should get a bigger pumpkin—right? Young harvesters use estimation skills to make a hypothesis about how many seeds they will find in a pumpkin before examining the real number inside.
Education World
Pumpkin Puzzler
Light the Halloween festivities with an exercise that connects math, physical science, and language arts. After watching a demonstration of a burning candle, learners use division, multiplication, or algebra to determine how many boxes...
CK-12 Foundation
And and Or Statements: Number Lines
Compound statements are actually quite simple. A virtual interactive provides a means to graph solution sets to compound statements involving and and or. Users then answer a few challenge questions on these solution sets.
CK-12 Foundation
Formulas for Problem Solving: Finding Distance, Rate, and Time
Go the distance in learning about distance, rate, and time. Young mathematicians use an interactive to investigate the relationship between distance, rate, and time. A set of challenge questions assesses understanding of these...
CK-12 Foundation
Mode: Kittens
It is not as difficult as herding cats. The short interactive provides a group of kittens to sort according to their colors. Pupils determine the mode of the number of kittens by color. The questions continue with other numbers of...
CK-12 Foundation
Mode: Mucho Money
Generate stacks of money. Given bills of different denominations, pupils stack them based on their values. The learners figure out which value is the mode of the data and determine whether the data is unimodal, bimodal, or multimodal.
CK-12 Foundation
Mode: Boxes of Oranges
See how your data stacks up. Pupils stack crates of oranges in increasing order, creating a simple bar graph. Using the graph, individuals determine measures of center and describe the shape of the distribution. Scholars determine what...
CK-12 Foundation
Mean: Harmonic Mean
Let the means live in harmony. With lengths representing the values of a small data set, learners compare the arithmetic mean to the harmonic mean. The pupils determine which value is the most accurate representation of the average of...
CK-12 Foundation
Mean: Arithmetic Mean
How is a mean affected by changes in data? A well-designed animation allows individuals to manipulate data and watch the effect on the mean. Challenge questions help guide users to conclusions about outliers and skew within data.
CK-12 Foundation
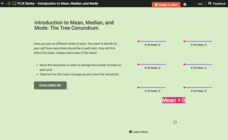
Introduction to Mean, Median, and Mode: The Tree Conundrum
How many trees should we plant? Using an interactive as a manipulative, individuals find the mean, median, and mode for sets of data. They determine the number of trees to plant in each plot of land to reach a statistical goal.
CK-12 Foundation
Simple Random Sampling: How Many Samples Does it Take to Change a Light Bulb?
Teach the concept of simple random sampling through an interactive lesson. Learners explore the concept by considering the strength of sampling methods. Size of the samples varies also as individuals determine which methods lead to the...
CK-12 Foundation
Two-Sided Stem-and-Lead Plots: Gamers
Which gender spends more time playing video games? Your classes use provided data to answer this question. They first build a two-sided stem-and-leaf plot and then use the display to look for patterns. Guiding questions help them...
CK-12 Foundation
Stem-and-Leaf Plots and Histograms: Digital Photography
Cameras use histograms to communicate the exposure of a photograph. An interesting lesson uses this idea to help learners deepen their understanding of histograms. It highlights the skew of the graphs by showing under- and overexposed...
CK-12 Foundation
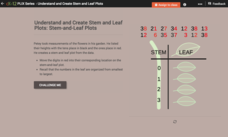
Understand and Create Stem-and-Leaf Plots: Stem-and-Leaf Plots
Explore the advantages to using a stem-and-leaf plot using an online lesson. Learners manipulate an animation to create a stem-and-leaf plot. They then calculate statistics for the data using their display. Guiding questions help them...
CK-12 Foundation
Understand and Create Stem-and-Leaf Plots: Event Survey
A good lesson doesn't just grow on trees! Help your classes understand the concept of a stem-and-leaf plot using an interactive lesson. Learners first create a stem-and-leaf plot from a set of data by dragging the values to the...
CK-12 Foundation
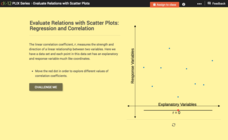
Evaluate Relations with Scatter Plots: Regression and Correlation
Introduce the concept of a correlation coefficient using an interactive lesson. Learners begin by manipulating a correlation coefficient and watching a graph change to represent the new value. Questions help strengthen their...
