University of Waikato
Ocean Acidification and Eggshells
Eggshells and seashells have a lot in common. Learners use the similarities to conduct an experiment that models the effect of ocean acidification on marine animals. Using varying levels of acidic liquids, pupils make observations on the...
University of Waikato
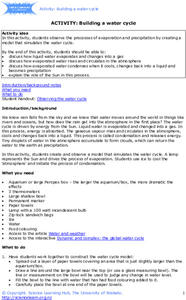
Building a Water Cycle
Bring the water cycle to life with in the classroom. Young scientists use household materials to create and monitor a water cycle model. They record changes in the water levels and make observations of where and how fast precipitation...
University of Waikato
Looking at Water - Solid, Liquid, or Gas
Here's a tip: only one substance is commonly found as a solid, liquid, and gas. Learners use that knowledge as they investigate the properties of water in each state. They interact with water in each of its three phases and record what...
University of Waikato
Temperature, Salinity and Water Density
The difference between sinking and floating may be a little salt. Young experimenters analyze the effect of salt and temperature on the density of water. They use their results to predict the effect of climate change on ocean ecosystems.
University of Waikato
Build a Marine Food Web
Dive into a lesson on marine ecosystem interactions. Individuals learn about and devise a marine food web. The resource provides organism cards and pupils use article resources to discover interactions before modeling them in a food web.
American Museum of Natural History
Keeping a Field Journal
Recording scientific evidence allows for important discoveries and conclusions. A remote learning resource outlines how to create a field journal to record scientific observations. The outline resource includes notation about the...
American Museum of Natural History
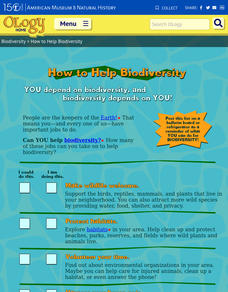
How to Help Biodiversity
A resource provides a checklist of nine actions for pupils to take to do their part in supporting biodiversity. The list suggests more obvious actions such as supporting wildlife to less obvious ideas like learning about different...
American Museum of Natural History
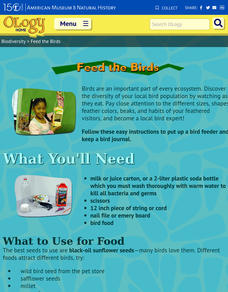
Feed the Birds
What kinds of birds are common in the area? Young scientists use household supplies to create bird feeders. They then document the birds that come to their feeders by keeping journals.
American Museum of Natural History
Endangered Species Game
Multiple factors affect the survival of endangered species. A hands-on activity has learners explore those factors. They play a board game that highlights factors such as human influence, habitat availability, and new species introduction.
American Museum of Natural History
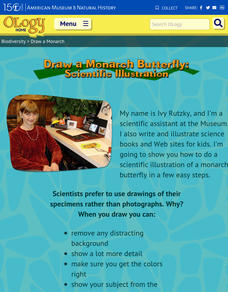
Draw a Monarch Butterfly: Scientific Illustrations
One doesn't have to be an artist to appreciate nature. A thorough resource shows pupils how to create detailed illustrations of a monarch butterfly. The lesson highlights the benefits of creating scientific drawings as opposed to simply...
Equality and Human Rights Commission
Learning area 5: Job Done!
Four activities conclude a unit through discussion and activities inspired by reflection. Scholars revisit their storybook from the first unit. Self-portraits showcase thought bubbles with written statements. Groups write and perform a...
Equality and Human Rights Commission
Learning area 4: Learn About the Meaning of Community
Scholars examine the jobs found in their community by way of surveying. After collecting data, pupils analyze their findings and share their observations with their peers. A video sparks interest. Two posters motivate participants to...
Equality and Human Rights Commission
Learning area 1: Who am I?
Five activities encourage scholars to dream big and celebrate the similarities and differences of those around them. Learners take part in two active practices that showcase how their peers are the same and different. Worksheets...
Equality and Human Rights Commission
Learning area 2: Challenging Stereotypes and Discrimination
Six powerful and eyeopening lessons provide scholars with activities designed to challenge stereotypes and discrimination. The unit provides reading material with which pupils read and discuss. Grand conversations lead to physically...
US Department of Commerce
Looking at Numbers of Births Using a Line Graph
Was there a baby boom? Using census data, class members take a look at the number of 8-11 year olds and determine their birth years. Scholars create a double line graph to compare the number of births for two states for several years....
US Department of Commerce
Applying Correlation Coefficients - Educational Attainment and Unemployment
Correlate education with unemployment rates. Individuals compare state and regional unemployment rates with education levels by calculating the correlation coefficient and analyzing scatter plots. Pupils begin by looking at regional data...


