Flipped Math
Unit 1 Review: Analyze Graphs and Expressions
Get in one last practice. Pupils work through 12 problems and a performance task to review the topics in Unit 1. The problems cover analyzing and modeling with graphs, algebraic properties of equality, and adding, subtracting, and...
Flipped Math
Modeling with Graphs
Create a graph for anything in the world. Pupils continue to work with graphs that model situations. The learners analyze different graphs to answer questions about the scenario along with finding equations of graphs. Scholars use...
Flipped Math
Create and Analyze Graphs
Model the world with graphs. Pupils watch and participate in creating graphs to model real-world situations. The presenters stress the importance of a consistent scale and proper labels for the graphs along with identification of the...
Flipped Math
Calculus AB/BC - Connecting Multiple Representations of Limits
It's time to put it all together. Viewers of an informative video learn to connect multiple representations of limits. Given algebraic, tabular, and graphical representations of a linear piecewise function, they determine whether a limit...
University of Colorado
Solving a Mixed Up Problem
Begin the process of adding and subtracting spectra. Having a basic understanding of occultation events, pupils begin the pursuit to determine what a found atmosphere might contain. Learners work with two graphs and calculate what the...
Radford University
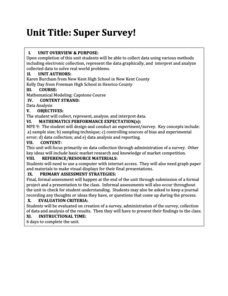
Super Survey!
Here's a super survey on supermarket products. An interactive lesson has classmates design and conduct surveys on a product of interest. They analyze the data, choose a data display method, and present their findings to the class.
Radford University
Let's Buy a Car
Ready to buy a car? Learners research different makes and models of cars to decide on the best one to buy. They collect data on cost, fuel efficiency, safety ratings, and insurance costs, then create and analyze data displays to make...
Learning Games Lab
Scientific Graph Reading
Interpreting graphs is an essential skill for young scientists. An interactive online lesson gives individuals an opportunity to review the components of a graph and learn to read and interpret the shape of a graph. The lesson includes...
Rice University
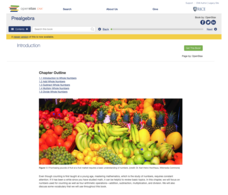
Prealgebra
Pre-algebra—all wrapped up in one place. The eBook contains everything needed to teach a typical Pre-Algebra course. Concepts in the course build upon previously learned concepts, allowing mathematicians to see the connections between...
Concord Consortium
People and Places
Graph growth in the US. Given population and area data for the United States for a period of 200 years, class members create graphs to interpret the growth over time. Graphs include population, area, population density, and population...
Concord Consortium
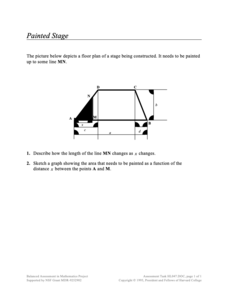
Painted Stage
Find the area as it slides. Pupils derive an equation to find the painted area of a section of a trapezoidal-shaped stage The section depends upon the sliding distance the edge of the painted section is from a vertex of the trapezoid....
Corbett Maths
Area under a Graph
What? The calculation of area is a linear distance? A short video shows how to use the areas of simple polygons to estimate the area under a graph. Pupils divide the area under a curve into figures to easier calculate the area. Given...
Mathed Up!
Distance Time Graphs
If only there was a graph to show the distance traveled over a period of time. Given distance-time graphs, pupils read them to determine the answers to questions. Using the distance and time on a straight line, scholars calculate the...
CCSS Math Activities
Smarter Balanced Sample Items: 8th Grade Math – Claim 4
A math model is a good model. A slide show presents 10 sample items on modeling and data analysis. Items from Smarter Balanced illustrate different ways that Claim 4 may be assessed on the 8th grade math assessment. The presentation is...
CCSS Math Activities
Vincent’s Graphs
What in the world are they doing? Given two graphs, scholars interpret the graphs and connect them to a real-world situation. They must also draw a graph given information about a context.
Mascil Project
Epidemics: Modelling with Mathematics
The Black Death epidemic is responsible for more than one million deaths in the United Kingdom. An inquiry-based activity has young scholars explore the rate of disease spread. They then analyze graphs showing data from epidemics such as...
Physics Classroom
Using Graphs
Many university professors complain incoming scholars struggle with interpreting graphs. A skill builder offers three different types of exercises including calculating slope, interpreting graphs, and extrapolating outside the plotted...
Physics Classroom
Graph That Motion
Pupils apply their knowledge of the shape and slope of graphs to interpret the motion of an object. Three levels of difficulty provide plenty of practice with support thanks to the "Help Me!" button offered with each question.
Kenan Fellows
Reading Airline Maintenance Graphs
Airline mechanics must be precise, or the consequences could be deadly. Their target ranges alter with changes in temperature and pressure. When preparing an airplane for flight, you must read a maintenance graph. The second lesson of...
Howard Hughes Medical Institute
Lactase Persistence: Evidence for Selection
What's the link between lactase persistence and dairy farming? Biology scholars analyze data to find evidence of the connection, then relate this to human adaptation. Working individually and in small groups, learners view short video...
Alabama Learning Exchange
Building Functions: Inverse Functions from Tables and Graphs
Is the inverse a function? Scholars learn how to examine a function to answer this question. Using an online interactive, they examine the properties of inverse functions to compare to the original function.
CK-12 Foundation
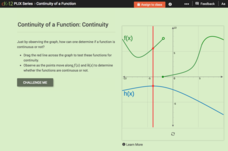
Continuity of a Function: Continuity
Does the point continually move along the graph? Pupils drag a line across two functions to determine whether they are continuous or not. They answer questions about the properties of continuous and discontinuous functions. Using their...
CK-12 Foundation
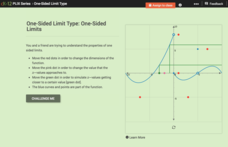
One-Sided Limit Type: One-Sided Limits
Not everything that's one-sided is bad. A slider interactive aids learners in investigating one-sided limits from graphs. A set of challenge questions assesses their understanding of the relationship between one- and two-sided limits.
CK-12 Foundation
Evaluate Limits Using Graphs and Tables: Where Is That Limit?
Limits are made easy through graphs and tables. An easy-to-use interactive lets users change a function on a coordinate plane. They relate graphs and tables to the limit at a specific value.


