CK-12 Foundation
Expected Value: Game of Chance
Determine whether the payoff is worth it. Pupils calculate the expected value of a game with three different payoff levels. Each level has a different probability of winning money. The scholars find the expected payoffs for each...
CK-12 Foundation
Expected Value: Creating a Discrete Probability Distribution Table
Wanna roll the dice? Determine whether it is a good idea to play a dice game. An interactive presents the rules for a game of dice. Pupils find the probabilities of each event and calculate the expected value of the game. They finish...
CK-12 Foundation
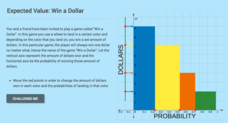
Expected Value: Win a Dollar
Spin a wheel, land on a color ... and win. Learners create a graph to display the probabilities of the amount of money they can win by spinning a colored wheel. The pupils use the dollar amounts and their probabilities to calculate the...
CK-12 Foundation
Expected Value: Playing Darts
The expected payoff is right on target. An interactive resource provides a dart game scenario with amounts of cash prizes and probabilities of winning. Learners calculate the expected value and expected payoff for the game. To...
Utah Education Network (UEN)
Probability and Statistics
MAD about statistics? In the seventh chapter of an eight-part seventh-grade workbook series, learners develop probability models and use statistics to draw inferences. In addition, learners play games and conduct experiments to determine...
Illustrative Mathematics
Fred's Fun Factory
Spin to win! Individuals calculate the average number of tickets expected based on a probability distribution for the number of tickets per spin. Pupils use that information to determine the average number of tickets that can be won...
EngageNY
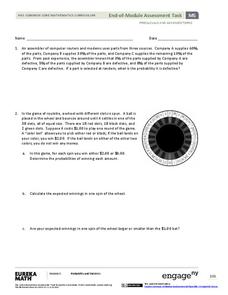
End-of-Module Assessment Task - Precalculus (Module 5)
Give your young scholars a chance to show what they've learned from the module. The last installment of a 21-part series is an end-of-module assessment task. It covers basic and conditional probabilities, expected value, and...
College Board
2010 AP® Statistics Free-Response Questions Form B
Form a good familiarity with the AP® test using Form B of the 2010 AP® Statistics free-response questions. Pupils use a test from a previous administration to prepare for their exams. A set of six questions assesses box plots,...
College Board
2003 AP® Statistics Free-Response Questions Form B
Update the statistics in your course using older AP® questions. The 2003 AP® Statistics free-response questions cover several of the concepts in the current statistics standards for all pupils. Items contain questions about...
College Board
1999 AP® Statistics Free-Response Questions
Closer to 2010 than expected. Several of the 1999 AP® Statistics free-response questions align to Common Core standards. Items ask pupils to analyze residuals, two-way tables, and calculate expected values to determine the fairness...
EngageNY
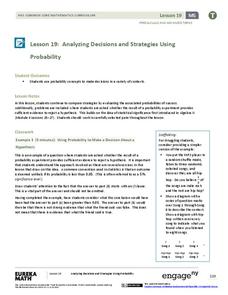
Analyzing Decisions and Strategies Using Probability 2
Explore how to compare and analyze different strategies. In the 20th installment of a 21-part module, scholars continue their analysis of decisions and strategies from the previous instructional activity. They then extend this concept to...
Curated OER
Continuous Probability Distributions
In this continuous probability distribution worksheet, learners identify discrete and continuous distributions. They calculate the linear combination of the independent normal random variable and determine probabilities using exponential...
College Board
2015 AP® Statistics Free-Response Questions
Statistics is all about making inferences. Can you infer how your pupils will fair on their AP® exams? Collect your own data by giving them practice tests such as the 2015 free-response exam. The six-question test includes topics such as...
Curated OER
Math Applications
In this math applications worksheet, students solve one word problem that has two parts to it. First, they determine the expected value of a ticket for a prize. Then, student determine the fair price for the ticket purchased and explain...
Illustrative Mathematics
Sounds Really Good! (Sort Of...)
Winning a lottery game with 60% odds sounds like a no brainer. This is when the math kicks in to show players that in the long run, they lose money the more often they play. Here is one simple question that opens the doors to a nice...
Curated OER
Math Applications 2
In this probability worksheet, students solve 1 word problem with three different parts to it. First, they find the probability of drawing an ace from a deck of cards. Then, students determine the probability that they will draw an ace...
Curated OER
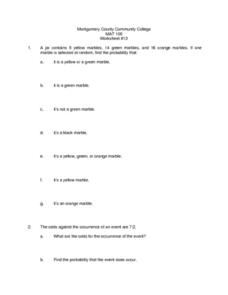
Math Applications 13
In this probability worksheet, students solve 2 different problems that include 7 parts in the first one and 2 parts in the second. First, they find the probability that one marble selected at random from a jar will be yellow or green....
Rice University
Introductory Statistics
Statistically speaking, the content covers several grades. Featuring all of the statistics typically covered in a college-level Statistics course, the expansive content spans from sixth grade on up to high school. Material...
Curated OER
The Apple Blossom Problem
In this apple blossom problem, students examine a given situation in a board game. They determine the best way to win the game and the expected payoff. This one-page worksheet contains 1 problem.
101 Questions
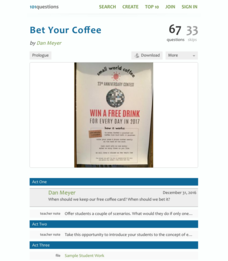
Bet Your Coffee
Coffee drinkers, rejoice, here's a chance to win free coffee! Coffee club card holders have the chance to win free coffee every day for a year—but they must enter using their cards good for a free cup. Scholars weigh the chances of...
EngageNY
Margin of Error When Estimating a Population Mean (part 1)
We know that sample data varies — it's time to quantify that variability! After calculating a sample mean, pupils calculate the margin of error. They repeat the process with a greater number of sample means and compare the results.
College Board
2004 AP® Statistics Free-Response Questions
Provide some practice showing the work. Pupils work through six free-response questions that require them to show their work. They use their knowledge of statistics to develop solutions to problems within context. Scenarios range from...
College Board
2001 AP® Statistics Free-Response Questions
Develop a complete understanding of the course. Pupils and teachers use the six free-response questions to gather information about aspects of the AP® Statistics course. The resource and test section show how items cover the content. A...
Radford University
A Change in the Weather
Explore the power of mathematics through this two-week statistics unit. Pupils learn about several climate-related issues and complete surveys that communicate their perceptions. They graph both univariate and bivariate data and use...


