Statistical Correlation Teacher Resources
Find Statistical Correlation lesson plans and worksheets
Showing 2,772 resources
Flipped Math
Experimental Design
Experimentally, come up with a study design. Learners hear about different types of study designs, observational studies, and experiments. They identify the subjects, response variable, treatment, and whether there was a cause and...
Curated OER
Line of Best Fit
In this line of best fit worksheet, students solve and complete 8 different problems that include plotting and creating their own lines of best fit on a graph. First, they study the samples at the top and plot the ordered pairs given on...
American Statistical Association
You and Michael
Investigate the relationship between height and arm span. Young statisticians measure the heights and arm spans of each class member and create a scatter plot using the data. They draw a line of best fit and use its slope to explain the...
American Statistical Association
How Tall and How Many?
Is there a relationship between height and the number of siblings? Classmates collect data on their heights and numbers of brothers and sisters. They apply statistical methods to determine if such a relationship exists.
Mathematics Assessment Project
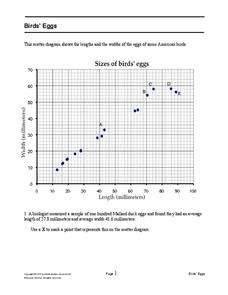
Bird’s Eggs
Are the length and width of birds' eggs related? Young ornathologists use a scatter plot to investigate the relationship between the length and width of eggs for Mallard ducks. They then determine the egg with the greatest...
Education Development Center
Geography of the Coordinate Plane
Put the graph into graphing and allow learners to understand the concept of point plotting and how it relates to data. The worksheet provides a nice way to connect data analysis to a graph and make predictions. The worksheets within...
K20 LEARN
Transpiring Trees: Plant Transpiration and the Water Cycle
Looking for a tree-rific addition to your water cycle unit? Teams of young foresters examine the role of transpiration in the water cycle through a week's worth of activities. Pupils analyze how trees take in and transport water during...
K12 Reader
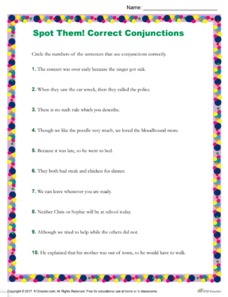
Spot Them! Correct Conjunctions
Young grammarians demonstrate their understanding of conjunctions by identifying sentences on a short worksheet that use conjunctions correctly.
College Board
2000 AP® Psychology Free-Response Questions
The New York City police chief wants to know if teens commit more crimes after watching violent television shows. What kind of study helps answer the question? Learners must describe a successful study. They also examine the...
College Board
2013 AP® Psychology Free-Response Questions
A school district is trying to get its learners to read more, but what is the best way to motivate them? A scenario investigates whether the district should use pizza coupons to encourage literacy. Other practice questions from College...
College Board
2005 AP® Statistics Free-Response Questions
A little context will go a long way. The six released free-response questions from the 2005 exam, show how AP® Statistics uses context within their problems. Pupils use the questions to practice their statistics skills within real-world...
College Board
2002 AP® Statistics Free-Response Questions
Statistically, prepared classes perform better. Teachers and pupils use the released 2002 AP® Statistics Free-Response questions to gain an understanding of how questions may be worded on the exam. Resources request that teachers put an...
College Board
2002 AP® Statistics Free-Response Questions Form B
Develop a deeper understanding of statistics. The six released free-response items from the 2002 AP® Statistics Form B involve several concepts that are currently in the regular statistics standards. Teachers see how...
College Board
2007 AP® Statistics Free-Response Questions Form B
So that is how they do it! Pupils and teachers see how College Board assesses topics using the free-response questions from Form B of the 2007 AP® Statistics test. The six questions are divided in two sections, the first five being...
Radford University
Mathematical Modeling: Lessons 2-3
Not all functions are created equal. Pupils apply regression analysis using polynomial, exponential, and logarithmic functions to investigate the relationship between variables and to decide which function would be best to model the...
Radford University
Danger! – An Analysis of the Death Toll of Natural Disasters
Decipher the danger of natural disasters. Using researched data, scholars work in groups to create data displays on the number of deaths from different types of natural disasters. They share their graphical representations with the class...
Radford University
Is it Really a Small World After All?
Working in groups, learners research four countries' populations over the past 30 years. Using the data collected, the teams find regression equations that best fit the data. Taking the regression equations, they then make predictions...
Curated OER
Lines of Fit
Students graph an equation and analyze the data. For this algebra lesson, students graph scatter plots and identify the line of best fit using positive correlation, negative correlation an d no correlation. They apply their data analysis...
Curated OER
Lines of Fit
Students graph an equation and analyze the data. For this algebra lesson, students graph scatter plots and identify the line of best fit using positive correlation, negative correlation an d no correlation. They apply their data analysis...
Curated OER
What Can Scatterplots Tell Us?
Eighth graders use data from surveys conducted with parents, peers and themselves to create computer-generated scatterplots. They make inferences from their scatterplots.
Curated OER
The Fact Finders
Young scholars analyze agricultural data and make predictions about events in history. In this history lesson, students correlate the relationship between historic events and issues in agriculture to see if there is a correlation. They...
Curated OER
Line Best Fit
Students identify the line of best fit. In this statistics lesson, students analyze graphs and plots to identify positive, negative or no correlation. They find the line of best fit for different scatter plots.
Curated OER
Binge Drinking and Drug Use
Students critically evaluate young peoples' comments on under age drinking. They map out valleys tieing together communities and drinking problems in a variety of situation. In addition, they correlate drinking and education in schools...
Curated OER
Teaching the Beatles' "Yellow Submarine":A Handout for ESL/EFL Students
Students inspire communication skills thru the lyrics of a song. Students watch and correlate the production of a fantasy film with speaking and listening skills. Students quote the themes from the video.
Other popular searches
- Negative Correlation
- Number Correlation
- Coefficient of Correlation
- Correlation Coefficients
- Linear Correlation
- Analyzing Correlations
- Correlation of Data Sets
- Math Teks Correlation
- Scatterplots and Correlation
- Scatter Plots and Correlation
- Correlation and Causation
- Statistics Correlation


