Media Smarts
Taking Charge of TV Violence
Encourage your class to become aware of the violence that is present in children's television programs and how this violence can influence children. Do this by holding the planned class discussion in this lesson plan and providing...
Math Moves U
Collecting and Working with Data
Add to your collection of math resources with this extensive series of data analysis worksheets. Whether your teaching how to use frequency tables and tally charts to collect and organize data, or introducing young mathematicians to pie...
Media Smarts
Violence on Television
Focus on a specific incident of violence on television in the case of the Canadian Broadcast System showing Silence of the Lambs on public television. Look at the broadcasting codes and a complaint that was filed against the Association....
Media Smarts
Teaching TV: Critically Evaluating TV
Mercer Mayer's There's a Nightmare in my Closet creates the framework for a specific discussion of nightmares generated by TV and a more general discussion of other emotions evoked by programs.
Media Smarts
Thinking About Television and Movies
As part of their study of the influence of TV and films, class members consider how music, lighting, costumes, camera angles, etc. are used to influence the response of viewers.
Curated OER
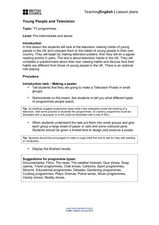
Young People and Television
Learners explore communication by participating in a role playing lesson. In this media analysis lesson, students answer surveys about their own television watching habits and compare them to the rest of the class. Learners complete...
K20 LEARN
You’re The Network: Data Analysis
How do you rate? Young scholars use graphical data to analyze ratings of different television episodes. Their analyses include best-fit lines, mean, median, mode, and range.
Curated OER
TV Weather Announcers
Elementary schoolers collect and record weather data for their local area using data from newspapers, Web sites, and television reports. The read and record data daily, and groups prepare a presentation on their findings for the entire...
DocsTeach
Challenger Explosion Photograph Analysis
Young historians turn into detectives in a thought-provoking activity on the Challenger Explosion. The activity uses an image of President Reagan watching the Challenger explode on live TV to help academics practice historical analysis....
Curated OER
Advertising Analysis
In ten questions, this advertising analysis activity addresses audience, persuasive techniques like logos, pathos, and ethos, as well as the purpose of the commercial. This is useful as homework while watching television, and it applies...
Curated OER
How Much Do I Watch TV?
In this television watching worksheet, young scholars determine the amount of television they watch in a week by recording the names and times of the shows. They total the number of hours of watching time. You can use this with upper...
Media Smarts
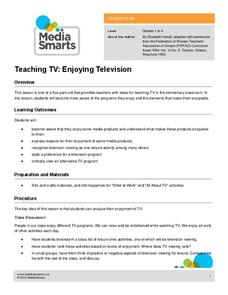
Teaching TV: Enjoying Television
What makes a TV program enjoyable? As an introduction to media analysis, kids identify their favorite programs and the elements they find engaging.
Brown University
Analyzing the News
With so many ways to follow the news today, it is imperative to think critically about the sources of information we are turning to. Here is a fantastic graphic organizer that will help your learners develop the skills to properly...
Media Smarts
TV Dads: Immature and Irresponsible?
Examine gender stereotypes on television, focusing on fathers portrayed in sitcoms and advertising. Questions on a handout direct learners to consider the types of fathers they see on television and one advertisement is highlighted as...
CK-12 Foundation
Fitting Lines to Data
Scatter the TV sales over weeks. Pupils create a scatter plot to display the number of TV sales over a period of several weeks. The interactive allows class members to create two lines of best fit. Then they determine which line fits...
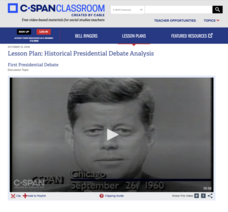
C-SPAN
Presidential Debate Analysis
The modern presidency is defined by the development of television—including the use of televised debates in the campaign. Using debates going back to the first one between John F. Kennedy and Richard Nixon, young scholars evaluate...
Curated OER
Art Reflecting Life
Have your young television viewers discuss popular shows among their peers. After choosing one show to analyze, middle and high schoolers read about the 2007-2008 network television lineup with the New York Times article "Gauging Viewer...
Curated OER
TV Survey - Data Collection and Analysis
In this data collection and analysis worksheet, 4th graders complete a tally chart about the number of hours that fourth graders watch television. They create a bar graph with the information, write a paragraph about the survey results,...
Curated OER
TV Tells it All
Young scholars discuss the concept of gender bias and stereotyping. In this social science lesson, students determine what the influence of television on gender roles represents and compares the chage in gender roles of today to those of...
Curated OER
Organizing Data
In this organizing data worksheet, 7th graders solve seven different types of problems related to data. They first identify the type of data as categorical, discrete or continuous from the information given. Then, students use Excel to...
Curated OER
Data Analysis and Bias
In this probability and statistics worksheet, learners determine when a collected data or a graph of the data could be biased. The one page worksheet contains four multiple choice questions. Answers are included.
Raytheon
Data Analysis and Interpretation
For this data analysis and interpretation worksheet, learners use charts, graphs, statistics to solve 42 pages of problems with answer key included.
Curated OER
Data collection and analysis
In this probability and statistics worksheet, high schoolers determine when a survey or collected data could be biased. The one page worksheet contains a combination of three multiple choice and free response questions. Answers are...
Media Smarts
Images of Learning: Secondary
Make your scholars more aware of stereotypical portrayals in film and television. Discuss the definition of "stereotypes" and how they are used to present a story. High schoolers look at specific television shows and complete a chart...


