Mathed Up!
Stem and Leaf Diagrams
Order the data within a stem-and-leaf display. Pupils take data and create and ordered stem-and-leaf diagrams, including the key. Participants take their data and determine answers about the information. Class members then find...
Inside Mathematics
Scatter Diagram
It is positive that how one performs on the first test relates to their performance on the second test. The three-question assessment has class members read and analyze a scatter plot of test scores. They must determine whether...
Curated OER
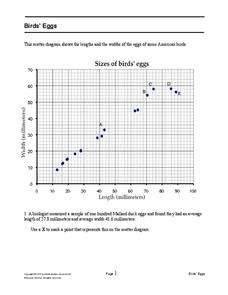
Birds' Eggs
More than just data, scatter plots are full of information that can be used to answer a variety of questions. This lesson uses a plot with information about bird egg sizes to answer questions about the relationship between length and...
CCSS Math Activities
Scatter Diagram
Don't let a great resource scatter to the winds. Pupils analyze two sets of test scores on a scatter plot. They draw a line of best fit and use it to make predictions about the test scores. They also consider any apparent trends in the...
Mathematics Assessment Project
Temperatures
As a middle school assessment task, learners first examine line graphs of monthly temperatures for two locations, and then match box plots to each line plot.
Inside Mathematics
Archery
Put the better archer in a box. The performance task has pupils compare the performance of two archers using box-and-whisker plots. The resource includes sample responses that are useful in comparing individuals' work to others.
Inside Mathematics
Population
Population density, it is not all that it is plotted to be. Pupils analyze a scatter plot of population versus area for some of the states in the US. The class members respond to eight questions about the graph, specific points and...
Mathematics Assessment Project
Bird’s Eggs
Are the length and width of birds' eggs related? Young ornathologists use a scatter plot to investigate the relationship between the length and width of eggs for Mallard ducks. They then determine the egg with the greatest...
Inside Mathematics
Snakes
Get a line on the snakes. The assessment task requires the class to determine the species of unknown snakes based upon collected data. Individuals analyze two scatter plots and determine the most likely species for five...
Noyce Foundation
Percent Cards
Explore different representations of numbers. Scholars convert between fractions, decimals, and percents, and then use these conversions to plot the values on a horizontal number line.
California Education Partners
Lashelles Garden
Let knowledge grow bountifully like plants in a garden. Given a diagram of a rectangular garden split into plots, scholars determine the area of the entire garden and the areas of the individual plots. As a culminating activity, they...
EngageNY
The Mean as a Balance Point
It's a balancing act! Pupils balance pennies on a ruler to create a physical representation of a dot plot. The scholars then find the distances of the data points from the balance point, the mean.
Bowland
Golden Rectangles
Scholars must determine the maximum area for a rectangular plot of land enclosed with 100 meters of rope. As the work they discover patterns and numerical approaches to solve the problem.
EngageNY
From Ratio Tables, Equations and Double Number Line Diagrams to Plots on the Coordinate Plane
Represent ratios using a variety of methods. Classmates combine the representations of ratios previously learned with the coordinate plane. Using ratio tables, equations, double number lines, and ordered pairs to represent...
CCSS Math Activities
Smarter Balanced Sample Items: High School Math – Target P
Learn how to show data in varied ways. A PowerPoint presentation provides six questions from the high school SBAC Claim 1 Target P item specifications. It covers creating data representations, interpreting and comparing data, and...
California Education Partners
Animals of Rhomaar
Investigate the growth rates of alien animals. Pupils study fictional animals from another planet to determine how much they grow per year. The investigators plot the growth of their animals over a period of time and then compare...
California Education Partners
Science Fair Project
Plant the data firmly on the graph. Given information about the growth rate of plants, pupils determine the heights at specific times and graph the data. Using the information, scholars determine whether a statement is true and support...
Inside Mathematics
Coffee
There are many ways to correlate coffee to life, but in this case a worksheet looks at the price of two different sizes of coffee. It requires interpreting a graph with two unknown variables, in this case the price, and solving for...
Mathematics Assessment Project
Middle School Mathematics Test 3
Real-life mathematics is not as simple as repeating a set of steps; pupils must mentally go through a process to come to their conclusions. Teach learners to read, analyze, and create a plan for solving a problem situation. The...
Mathematics Assessment Project
Middle School Mathematics Test 4
Raise expectations in your classroom and assess learners through the provided performance tasks. Class members must apply concepts learned throughout the year, providing a good measurement of how well they understand the...
Inside Mathematics
Suzi's Company
The mean might not always be the best representation of the average. The assessment task has individuals determine the measures of center for the salaries of a company. They determine which of the three would be the best representation...
EngageNY
Distance on the Coordinate Plane
Scholars learn how to find the distance of vertical and horizontal line segments on the coordinate plane in the 19th installment of a 21-part module. The use of absolute value comes in handy.
Los Angeles County Office of Education
Assessment For The California Mathematics Standards Grade 6
Test your scholars' knowledge of a multitude of concepts with an assessment aligned to the California math standards. Using the exam, class members show what they know about the four operations, positive and negative numbers, statistics...
Curated OER
Which is Closer to 1?
A seemingly simple question that reveals a lot about a student's understanding of fractions. In finding an answer, learners compare fractions with different denominators that are both greater and less than one. No number line is...
Other popular searches
- Short Story Plot Diagram
- Creation Myth Plot Diagram
- Plot Diagram the Outsiders
- Blank Story Plot Diagram
- Julius Caesar Plot Diagram
- Plot Diagram for Fiction
- Free Story Plot Diagram
- Creating Plot Diagram
- Story Plot Diagram Steps
- Folktale Story Plot Diagram
- Plot Diagram for Stories
- Story Plot Diagram Samples


