Curated OER
Representing Data 1: Using Frequency Graphs
Here is a activity that focuses on the use of frequency graphs to identify a range of measures and makes sense of data in a real-world context as well as constructing frequency graphs given information about the mean, median, and range...
Achieve
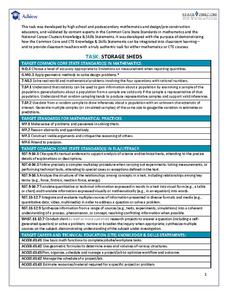
Task: Storage Sheds
Bridge the gap between mathematics and Career Technical Education. Pupils research the cost associated with building storage sheds and analyze possible profit. They build scale models and determine if building and selling the sheds is a...
American Statistical Association
A Sweet Task
Candy is always an effective motivator! A fun math activity uses M&M's and Skittles to explore two-way frequency tables and conditional probability. The candy can serve a dual purpose as manipulatives and experimental data.
Achieve
Ivy Smith Grows Up
Babies grow at an incredible rate! Demonstrate how to model growth using a linear function. Learners build the function from two data points, and then use the function to make predictions.
Bowland
Speedy Santa
Santa sure is fast. In the assessment task, learners calculate the number of minutes Santa can spend at each house. This calculation requires the use of given population demographics data.
Bowland
Tuck Shop
Correct a misleading conclusion. Individuals review a set of data and a conclusion to determine what is wrong with the conclusion. Pupils then represent the data with an appropriate display. Finally, learners develop a correct conclusion...
EngageNY
End-of-Module Assessment Task: Grade 7 Mathematics Module 5
Show learners how to use simulations and random sampling to reach conclusions with the last resource in a 25-part series. The assessment contains three scenarios, each with several parts, and covers comparing populations using random...
Bowland
Magic Sum Puzzle
Learners discover the magic in mathematics as they solve numerical puzzles involving magic sums. They then make a conjecture as to why no additional examples are possible based on an analysis of the puzzles.
Curated OER
Math On the Job
Investigate different types of math required for specific jobs. In this math in occupations lesson plan, use the Internet to research what type of math one might need to know in order to be successful in different jobs. Complete a...
SHS Algebra
Linear vs. Exponential Functions Tasks
Your algebra learners will enjoy the real-life application of the three tasks presented here. They complete a table and a graph comparing the two options presented. One option is linear, while the other is exponential. After coming up...
Illustrative Mathematics
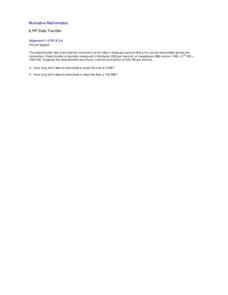
Data Transfer
A question to ask your class is, How fast is your Internet? That depends on the data transfer rate (DTR), which is the unit rate used in this activity. Math students will calculate how long it takes to download a music file and a video...
Inside Mathematics
Snakes
Get a line on the snakes. The assessment task requires the class to determine the species of unknown snakes based upon collected data. Individuals analyze two scatter plots and determine the most likely species for five additional data...
Inside Mathematics
Suzi's Company
The mean might not always be the best representation of the average. The assessment task has individuals determine the measures of center for the salaries of a company. They determine which of the three would be the best representation...
Inside Mathematics
House Prices
Mortgages, payments, and wages correlate with each other. The short assessment presents scatter plots for young mathematicians to interpret. Class members interpret the scatter plots of price versus payment and wage versus payment for...
Bowland
Football, the Beautiful Game
Discover how to use mathematics to make a stronger soccer team. Young soccer enthusiasts use given data to make decisions about a soccer team. They decide which position to assign each player, consider what makes a good pass and...
Illustrative Mathematics
Growing Bean Plants (Grade 2)
After planting a bean seed in a jar, young scientists observe the growth patterns over several days. As the bean becomes a sprout, and the sprout becomes a plant, partners measure and plot the data. They notice patterns, practice...
Mathematics Assessment Project
Middle School Mathematics Test 4
Raise expectations in your classroom and assess learners through the provided performance tasks. Class members must apply concepts learned throughout the year, providing a good measurement of how well they understand the material. The...
Concord Consortium
Here Comes the Sun
Many phenomena in life are periodic in nature. A task-based lesson asks scholars to explore one of these phenomena. They collect data showing the sunrise time of a specific location over the period of a year. Using the data, they create...
EngageNY
Choosing a Model
There's a function for that! Scholars examine real-world situations to determine which type of function would best model the data in the 23rd installment of a 35-part module. It involves considering the nature of the data in addition to...
Curated OER
College Athletes
When more basketball players are taller than field hockey players at a school, is it safe to say that in general they are always taller? The activity takes data from two college teams and your learners will be able to answer questions...
Concord Consortium
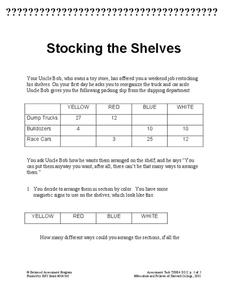
Stocking the Shelves
How many ways can you stock a shelf? It's probably more than you think! Young scholars use data in a frequency table to determine how many ways to stock a shelf given a specific constraint for types of groups. They then repeat the task...
EngageNY
Modeling with Exponential Functions
These aren't models made of clay. Young mathematicians model given population data using exponential functions. They consider different models and choose the best one.
Concord Consortium
Gestation and Longevity
Is the gestation length of an animal a predictor of the average life expectancy of that animal? Learners analyze similar data for more than 50 different animals. They choose a data display and draw conclusions from their graphs.
Mathematics Assessment Project
100 People
It's a small world after all. In the middle school assessment task, learners use data that imagines there are only 100 people in the world to answer questions about population demographics. Young mathematicians use ratio and proportional...


