Georgia Department of Education
Math Class
Young analysts use real (provided) data from a class's test scores to practice using statistical tools. Not only do learners calculate measures of center and spread (including mean, median, deviation, and IQ range), but also use this...
EngageNY
End-of-Module Assessment Task: Grade 8 Module 6
Test your knowledge of linear functions and models. The last installment of a 16-part module is an end-of-module assessment task. Pupils solve multi-part problems on bivariate data based on real-world situations to review concepts from...
Mathematics Vision Project
Module 9: Modeling Data
How many different ways can you model data? Scholars learn several in the final module in a series of nine. Learners model data with dot plots, box plots, histograms, and scatter plots. They also analyze the data based on the data...
Illustrative Mathematics
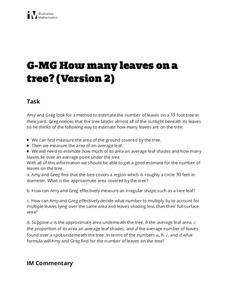
How Many Leaves on a Tree?
This is great go-to activity for those spring or fall days when the weather beckons your geometry class outside. Learners start with a small tree, devising strategies to accurately estimate the leaf count. They must then tackle the...
Noyce Foundation
Granny’s Balloon Trip
Take flight with a fun activity focused on graphing data on a coordinate plane. As learners study the data for Granny's hot-air balloon trip, including the time of day and the distance of the balloon from the ground, they practice...
Illustrative Mathematics
How Many Leaves on a Tree? (Version 2)
A second attack at figuring out the number of leaves on a tree, this activity makes both an excellent follow-up to version 1 and a stand-alone activity. Learners practice setting parameters and deciding acceptable estimate precision, and...
Inside Mathematics
Archery
Put the better archer in a box. The performance task has pupils compare the performance of two archers using box-and-whisker plots. The resource includes sample responses that are useful in comparing individuals' work to others.
Inside Mathematics
Population
Population density, it is not all that it is plotted to be. Pupils analyze a scatter plot of population versus area for some of the states in the US. The class members respond to eight questions about the graph, specific points and...
Radford University
Green Cravings
Build up a bag of green. Pupils determine the number of green Skittles in a snack bag and come up with a way to determine how many snack bags it would take to create one bag of only green Skittles. Classmates share their methods and...
Illustrative Mathematics
How Many Buttons?
Bring the class into the probability by having everyone count buttons on their shirts. Organize the data into the chart provided and chose different possibilities such as "female with one button" or "all students with more than four...
Mathematics Assessment Project
Sampling and Estimating: Counting Trees
Your task today: count all the trees on a tree farm. To complete the assignment, learners first estimate the number of trees on a tree farm using random sampling. To improve their own response they then evaluate provided responses to the...
Curated OER
Sweet Data
Students input data about the colors of their serving of M&M candies onto a spreadsheet. They create charts and graphs based on this information.
Curated OER
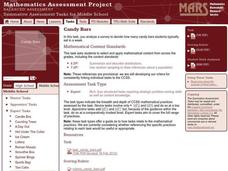
Candy Bars
There is often more to data than meets the eye. Scholars learn that they need to analyze data before making conclusions as they look at data that describes the number of candy bars boys and girls eat. They disprove a given conclusion and...
Curated OER
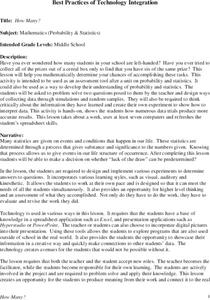
How Many?
Middle schoolers explore and design ways to collect data through simulations and random samples. They perform two experiments to determine the answers to various probability problems, and present the data/graphs in the form of a...
Bowland
Tuck Shop
Correct a misleading conclusion. Individuals review a set of data and a conclusion to determine what is wrong with the conclusion. Pupils then represent the data with an appropriate display. Finally, learners develop a correct conclusion...
Bowland
Speedy Santa
Santa sure is fast. In the assessment task, learners calculate the number of minutes Santa can spend at each house. This calculation requires the use of given population demographics data.
Inside Mathematics
Snakes
Get a line on the snakes. The assessment task requires the class to determine the species of unknown snakes based upon collected data. Individuals analyze two scatter plots and determine the most likely species for five additional data...
Inside Mathematics
Suzi's Company
The mean might not always be the best representation of the average. The assessment task has individuals determine the measures of center for the salaries of a company. They determine which of the three would be the best representation...
Concord Consortium
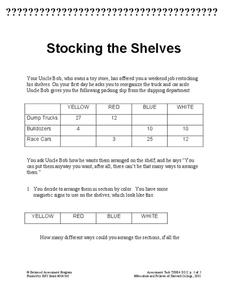
Stocking the Shelves
How many ways can you stock a shelf? It's probably more than you think! Young scholars use data in a frequency table to determine how many ways to stock a shelf given a specific constraint for types of groups. They then repeat the task...
Mathematics Assessment Project
Middle School Mathematics Test 4
Raise expectations in your classroom and assess learners through the provided performance tasks. Class members must apply concepts learned throughout the year, providing a good measurement of how well they understand the material. The...
Mathematics Assessment Project
100 People
It's a small world after all. In the middle school assessment task, learners use data that imagines there are only 100 people in the world to answer questions about population demographics. Young mathematicians use ratio and proportional...
Curated OER
College Athletes
When more basketball players are taller than field hockey players at a school, is it safe to say that in general they are always taller? The activity takes data from two college teams and your learners will be able to answer questions...
Mathematics Assessment Project
Patchwork
Sew up learning on writing rules for patterns with an assessment task that has pupils investigate the number of triangles needed for cushions of different sizes. They then use the data to generate a rule for a cushion of any size.
101 Questions
Class Height Distribution
A picture is worth a thousand words, and this is no exception! The introductory photo shows a group of classmates lined up in height categories; females and males are in different colors, and the shape of the curve they create is...


