Curated OER
Solving Quadratic Equations by Graphing
With his trusty graphing calculator, Sal begins his lecture on solving quadratic functions by graphing. The video is a good way to show young mathematicians not only how to use the graphing calculator (which Sal describes as "archaic"...
Khan Academy
Graphs of Square-Root Functions, Functions and Their Graphs, Algebra II
Though Sal expects viewers to be "reasonably familiar" with square roots, he takes this opportunity to explain some of the notation and how to graph square root functions. He uses a graphing calculator from my.hrw.com/math06 to...
Brightstorm
Dilations of Quadratic Graphs - Concept
Help learners recognize the characteristics of a quadratic graph and how changes affect them. An informative video uses a graphing calculator in order to find out what happens when the leading coefficient of a quadratic...
Bozeman Science
Graphing Data By Hand
We have calculators, so why do we have to do this by hand? The video takes viewers through graphing scientific data by hand to create a scatter plot. The process includes labeling axes, writing an appropriate title, determining a...
Flipped Math
Graphing Functions to Solve Equations
Intersections become solutions. Scholars watch a video on using a graphing calculator to find the solution to an equation in one variable. While watching the presentation, pupils practice working some of the examples and compare their...
Brightstorm
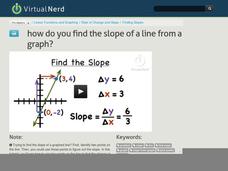
Finding the Slope of a Line from a Graph
Slope is the steepness of a line, but how do you quantify steepness? A video demonstrates how to find the slope of a line from a graph, either by counting vertical and horizontal change or by using the slope formula. Five...
National Education Association
Determine Minimum, Maximum, Vertex, and Zeros Given the Graph
Do not always be maxed out by the vertex. A short video introduces the graphical display of the vertex and zeros of a quadratic function. The presenter provides the definitions of the minimum and maximum of the graph along with...
Flipped Math
Graphing Polynomial Functions
Take a look in the window. Pupils watch a presentation to discover how to graph a polynomial using a graphing calculator and using the window to find the extrema. Scholars use their knowledge from previous lessons to gain a rough idea of...
Mathispower4u
Interpreting and Graphing Piecewise Functions
Learn how to graph a function that is in pieces. The Mathispower4u Algebra I Video interprets the graph of a piecewise function that represents a cellphone plan. Pupils use the graph to determine the cost for a given number of units...
Mathispower4u
Graphing Piecewise Defined Functions
Only choose the pieces needed. Pupils learn a way to graph piecewise functions by graphing the entire function and then only keeping the section of the graph that belongs to the piecewise function. The Mathispower4u video shows...
statisticsfun
How to Calculate Sample Size and Margin of Error
Explore the effect sample size has on margin of error and confidence interval. The instructor calculates the margin of error of fictional data. He shows how the calculation changes when the sample size changes while keeping the other...
Corbett Maths
Tangent Graph
Stay on course to learn about tangents. A brief video describes how to graph the tangent function. The method shown here is to make a table of tangent values to graph on the coordinate plane.
Brightstorm
Finding the Slope of a Line from a Graph - Concept
Explain how to find the slope of a graph of a line with a video that points out how no matter what two points are used on a graph of a line, the slope is the same. A few examples reiterate how to find the slope of vertical...
Flipped Math
Quadratics in Standard Form
Get ready to set the standard! Pupils watch a video on how to graph a parabola from a quadratic in standard form without converting the form. Scholars learn how to find the axis of symmetry from the equation and from there the vertex....
Curated OER
Find Zeros of a Function Given the Graph
Introduce zeros of a function and their relationship to the graph of the function. an informative video uses the definition of a zero to help identify them on a graph and provides several examples of finding the zeros of a...
FuseSchool
Calculator Trick—Table of Values
Work smarter, not harder! Learn a function of the calculator that assists with creating a table of values. The calculator does the work of substituting values and finding the input-output pairs.
Curated OER
How Do You Find the Slope of a Line from a Graph?
Given a line on a graph, what's the slope of this line? First, identify two points on the given line. Then, use a formula to find the change in y and then the change in x. This will be represented by rise over run. Watch this video to...
Mathispower4u
Solve a System of 2 Equations with 2 Unknowns by Graphing on the TI84 (Example)
Let the technology do the graphing. Learners watch a helpful algebra video that shows how to use a graphing calculator to solve a system of linear equations. The presentation works through one example using a TI-84 to solve a system and...
Curated OER
How Do You Use a Graph to Reflect a Figure Over the X-Axis?
A reflection is just what you think it is, a mirror image. So how do you reflect a figure on a graph? Just flip it over. The teacher illustrates how to select a line of reflection (the x-axis) and make the calculations to flip the figure.
Flipped Math
Calculus AB/BC - Sketching Graphs of Functions and Their Derivatives
Find deeper meaning in graphs. Pupils use the knowledge gained from the previous sections in the unit to sketch graphs of a function's derivative. Learners also see how to sketch a graph of a function given the graph of its derivatives....
Mathispower4u
Determine How a Final Exam Score Affect a Course Grade Using the TI84 (Weighted Averages Example)
Will this be on the final exam? A brief YouTube video shows scholars how to use the table feature of a graphing calculator to find the necessary score on a final exam to achieve a specific course grade. The example uses weighted averages...
Corbett Maths
Area under a Graph
What? The calculation of area is a linear distance? A short video shows how to use the areas of simple polygons to estimate the area under a graph. Pupils divide the area under a curve into figures to easier calculate the area. Given...
Flipped Math
Calculus AB/BC - Using the Candidates Test to Determine Absolute (Global) Extrema
Absolutely! Find the global maximum and minimums. Pupils watch a video showing how to find the absolute maximums and minimums of a function on an interval by testing critical points. The learners see how to determine whether a critical...
Corbett Maths
Graphs: Parallel lines
Parallel lines must always have the same slope. Learners use this bit of information to extend their equation writing skills. A video lesson explains how to write the equation of a line parallel to a given line and through a given point....


