EngageNY
The Graph of a Linear Equation—Horizontal and Vertical Lines
Graph linear equations in standard form with one coefficient equal to zero. The lesson plan reviews graphing lines in standard form and moves to having y-coefficient zero. Pupils determine the orientation of the line and, through a...
Mathed Up!
Distance Time Graphs
If only there was a graph to show the distance traveled over a period of time. Given distance-time graphs, pupils read them to determine the answers to questions. Using the distance and time on a straight line, scholars calculate the...
Mathed Up!
Drawing Quadratic Graphs
Curve through the points. The resource, created as a review for the General Certificate of Secondary Education Math test, gives scholars the opportunity to refresh their quadratic graphing skills. Pupils fill out function tables to...
EngageNY
Revisiting the Graphs of the Trigonometric Functions
Use the graphs of the trigonometric functions to set the stage to inverse functions. The lesson plan reviews the graphs of the basic trigonometric functions and their transformations. Pupils use their knowledge of graphing functions to...
Illustrative Mathematics
Graphing Rational Functions
The slider feature on Desmos excellently shows how graphs change based on different variable values. Learners look at two similar rational functions and compare and discuss what happens when the numbers go from positive to zero to...
Inside Mathematics
Graphs (2006)
When told to describe a line, do your pupils list its color, length, and which side is high or low? Use a worksheet that engages scholars to properly label line graphs. It then requests two applied reasoning answers.
EngageNY
Modeling a Context from Data (part 2)
Forgive me, I regress. Building upon previous modeling activities, the class examines models using the regression function on a graphing calculator. They use the modeling process to interpret the context and to make predictions...
Illustrative Mathematics
Graphs of Quadratic Functions
The equations look different, but their graphs are the same. How can that be? This activity leads your mathematicians in an exploration of three different forms of the same quadratic function. After comparing the equations, their graphs,...
Balanced Assessment
Cost of Living
Math scholars investigate the cost of living in Hong Kong compared to Chicago but must first convert the different types of currency. They then choose a type of graph to compare different spending categories and finish the activity by...
EngageNY
The Line Joining Two Distinct Points of the Graph y=mx+b Has Slope m
Investigate the relationship between the slope-intercept form and the slope of the graph. The lesson plan leads an investigation of the slope-intercept equation of a line and its slope. Pupils realize the slope is the same as the...
Concord Consortium
Crossing the Axis
Mathematicians typically reference eight different types of functions. Scholars learn about the requirements for graphing a function and must decide how many different functions fit. To finish, they define each specific function meeting...
Illustrative Mathematics
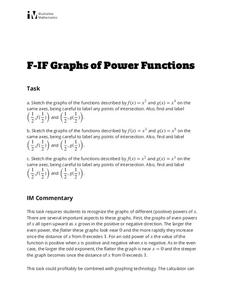
Graphs of Power Functions
This activity consists of three exercises in which learners sketch the graphs of various power functions on the same axes. They use their sketches to make comparisons and observations which lead to generalizations about the graphs...
Concord Consortium
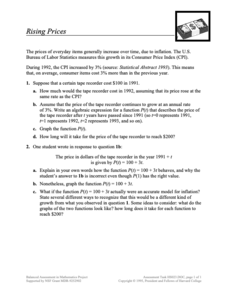
Rising Prices
What will that cost in the future? The scenario provides pupils with a growth as a Consumer Price Index. Learners create functions for a given item to determine future prices and graph them. Class members then compare their functions to...
Concord Consortium
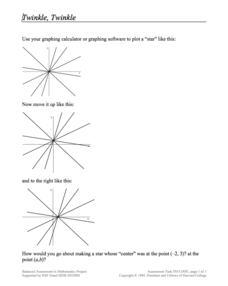
Twinkle, Twinkle
Take a look at a star resource. Young mathematicians use a graphing calculator to draw intersecting lines that look like a star. They then apply translations to move the entire star and also consider what transformations must occur to...
Achieve
BMI Calculations
Obesity is a worldwide concern. Using survey results, learners compare local BMI statistics to celebrity BMI statistics. Scholars create box plots of the data, make observations about the shape and spread of the data, and examine the...
Concord Consortium
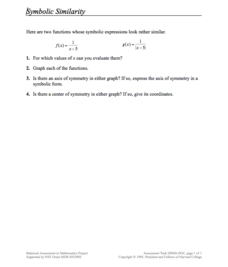
Symbolic Similarity
How many things does one transformation tell you? Learners compare and contrast the graphs of different parent functions with the same transformation. Using a rational and absolute value function, pupils identify key features of their...
Concord Consortium
Rational and Not So Rational Functions
Do not cross the line while graphing. Provided with several coordinate axes along with asymptotes, pupils determine two functions that will fit the given restrictions. Scholars then determine other geometrical relationships of asymptotes...
Illustrative Mathematics
Puzzle Times
Give your mathematicians this set of data and have them create a dot plot, then find mean and median. They are asked to question the values of the mean and median and decide why they are not equal. Have learners write their answers or...
Mathed Up!
Transformation of Graphs
In what ways can you transform a graph? An engaging video answers this question as it covers reflections, translations, and stretches of graphs. To test their knowledge, individuals complete a set of problems to apply this knowledge.
Concord Consortium
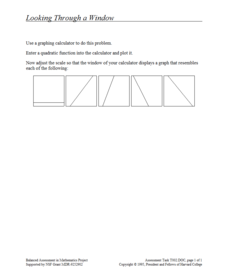
Looking through a Window
Here's a window into graphing calculators. Scholars use a graphing calculator to plot a quadratic function. They then adjust the window to make the graph look like that of a linear function and must recreate given graphs.
Mathed Up!
Conversion Graphs
After watching a video on conversions, learners convert meters to feet, dollars to pounds, pounds to Euros, gallons to liters, and kilometers to miles. Then, they graph the conversion changes onto graph templates.
Concord Consortium
Graphical Depictions
Parent functions and their combinations create unique graphical designs. Learners explore these relationships with a progressive approach. Beginning with linear equations and inequalities and progressing to more complex functions,...
Concord Consortium
The Line and the Ellipse
What do a line and an ellipse have in common? Maybe zero, one, or two points! Learners consider the equation of an ellipse and a line to determine if their graphs have any shared points. They then write a system of equations, including...
Illustrative Mathematics
Puppy Weights
Nobody can say no to puppies, so lets use them in math! Your learners will take puppy birth weights and organize them into different graphs. They can do a variety of different graphs and detail into the problem based on your classroom...


