Curated OER
Quick Graphs of Linear Equations
Graph equations of lines using the slope-intercept method or by plotting both x and y intercepts. Determine if two lines are parallel or perpendicular by comparing their slopes. This handout includes step-by-step directions and four...
CK-12 Foundation
Families of Lines: Room in Perspective
Get a perspective of lines that share a point. The interactive displays a family of lines that share the same y-intercept. Individuals can find the equations of the lines by moving the line displayed and find what is common...
Curated OER
Hybrid Vehicles: Cut Pollution and Save Money
Math and science meet in this lesson on hybrid electric automobiles. This 24-page resource provides everything you need for teaching a lesson that compares the use of internal combustion engines to hybrid electric engines. Participants...
Flipped Math
Modeling with Graphs
Create a graph for anything in the world. Pupils continue to work with graphs that model situations. The learners analyze different graphs to answer questions about the scenario along with finding equations of graphs. Scholars use...
Curated OER
Linear and Quadratic Model, Data Modeling
Students model quadratic and linear equations. In this algebra instructional activity, students solve word problems using equations. They create scatter plots and make predictions using correlations.
Flipped Math
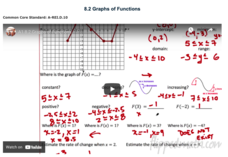
Graphs of Functions
Create a graphical description. Pupils watch a video presentation starting with vocabulary on properties of a graph of a function and then use the vocabulary to find key features of graphs of a function. Scholars use three graphs in the...
Flipped Math
Quadratics in Standard Form
Get ready to set the standard! Pupils watch a video on how to graph a parabola from a quadratic in standard form without converting the form. Scholars learn how to find the axis of symmetry from the equation and from there the vertex....
West Contra Costa Unified School District
Comparing Linear and Quadratic Functions
If a linear function and a quadratic function enter a boxing match, which one would win? Learners first review how to find key features of linear and quadratic functions. Next, they compare key features of pairs of functions.
Flipped Math
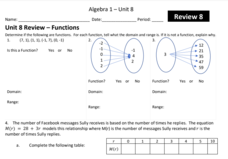
Unit 8 Review: Functions
Let's finish a functional review. Pupils work through 31 items to review the concepts learned in Unit 8. Scholars determine whether a mapping is a function and identify the domain and range. Using function notation, individuals then...
Flipped Math
Modeling with Quadratics
Do some interpretive modeling. Class members watch three examples of interpreting key features of a graph of a quadratic to find solutions to a real-world problem. Learners review how to find the key features on a graph using technology...
Radford University
Buying A Car
What is my monthly payment? Scholars research to find the perfect car for them to buy. Using the cost of the car, they determine a down payment and the amount of monthly payments using a zero interest loan. Finally, they investigate what...
Kenan Fellows
Let's Move
Find a statistical reason for a fresh start. Using a hypothetical scenario, individuals research statistical data of three different cities. Their goal? Find the best statistical reason for a business to move to a new location. Their...
Curated OER
X-Intercepts
In this x-intercepts, students explore the equations of a line, set "y" equal to zero to determine the x-intercept. Explanations and examples are provided. This two-page learning exercise contains ten problems.
Curated OER
Solving Linear Systems by Graphing
In this linear systems worksheet, 9th graders solve and complete 4 different problems by graphing. First, they graph the first equation shown. Then, students graph the second equation on the same coordinate system as the first. They also...
Curated OER
The Slope of a Line
In this slope worksheet, students examine graph and determine the slope of a line. They determine coordinates of a point to make a true statement. Students identify the dependent variable and the independent...
Curated OER
Other Equations of Lines
In this algebra worksheet, young scholars find equations for 4 lines when given their slope and one point on the line. They write two linear equations when given two points on a line. Students analyze the equations of 3 sets of linear...
Illustrative Mathematics
Downhill
A car traveling down a steep hill is the model for this resource. The confusion comes when the elevation, E, is given in terms of distance, d. The distance, d, is the horizontal distance from E. Therefore, the equation, E = 7500 – 250d,...
Del Mar College
All About Lines
This resource should be called "All About Lines, and Then Some!". Packed full of all the key components of linear functions, learners review how to set up different equations, find intercepts, and graph. All the main topics are included...
Curated OER
Rational Functions
For this college level Pre-Calculus worksheet students evaluate rational functions, identify the domain, vertical asymptotes, and x- and y-intercepts. The three page worksheet contains forty problems. Answers are provided.
Curated OER
Polynomial Functions
In this Pre-Calculus/Calculus worksheet, students graph polynomial functions, identifying the x- and y-intercepts as well as end behavior. The two page worksheet contains sixty problems. Answers are included.
Willow Tree
Linear Relationships
There's just something special about lines in algebra. Introduce your classes to linear equations by analyzing the linear relationship. Young mathematicians use input/output pairs to determine the slope and the slope-intercept formula to...
Curated OER
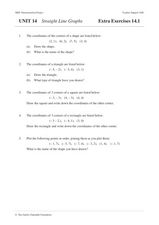
Straight Line Graphs
In this math instructional activity, students plot lines on a graph paper when given the equation for the line in slope-intercept form. They tell the values of the slope and the y-intercept. Students find the x and y intercepts and plot...
Curated OER
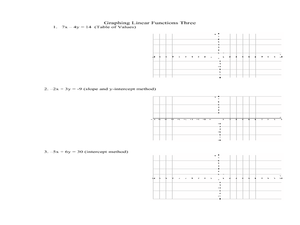
Graphing Linear Functions Three
In this algebra worksheet, learners are given an equation and asked to create a table of values and graph their equation. The other method they use for graphing is the slope intercept method, by solving the equation for y and identifying...
Curated OER
Compound Inequalities and Graphing
Put geometry skills to the test! Learners solve compound inequalities and then graph the inequalities on a coordinate plane using their geometric skills. They identify the slope and y-intercept in order to graph correctly. I like this...


