Curated OER
Taming of the Shrew Quiz, Act 5
Five questions help you assess readers' understanding of Act 5 of Shakespeare's Taming of the Shrew. Several of the questions go beyond basic understanding and require higher level thinking and analysis.
Southern Nevada Regional Professional Development Program
Common Core Reading Standards: Understanding Argument
What does your class know about logical fallacies? They can find out quite a bit and practice identifying logical fallacies if you follow the steps and use the resources provided here! After reviewing ethos, pathos, and logos, ask small...
Curated OER
The Art of Persuasion-Analysis of Argument
Analyze advertising techniques in order to pinpoint persuasive strategies that writers use. These same techniques are then examined in persuasive speeches. You will have to find your own advertisements, but speeches are included. Finish...
Curated OER
MLK Letter From Birmingham Jail Analysis
Designed as a PowerPoint presentation for AP English class, this resource provides a detailed analysis of the content, format, and purpose of Dr. Martin Luther King, Jr’s “Letter from the Birmingham Jail.” Because much of the...
Southern Nevada Regional Professional Development Program
Was Bias A Factor? Make an Argument
The ability to analyze an argument is a skill emphasized by the Common Core standards. Offer your class an opportunity to develop and hone their skills by providing them the testimonies in an Oregon court case. After reading the facts of...
Curated OER
Teacher Notes
Gathering information, distinguishing between arguments, preparing an oral presentation; these skills are fostered as 10th graders explore aspects of global trade and politics. They use the Internet to gather information about NATO, The...
Curated OER
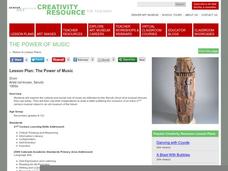
Lesson: The Power of Music
The sounds of the past echo through art and our social understanding. Will the sounds of today echo into the future? Learners discuss the cultural and social impact of music, then analyze the art on an African Drum. They develop...
Serendip
Soap Opera Genetics – Genetics to Resolve Family Arguments
Did she cheat on her husband? Did the hospital switch the babies? Should they have children? As much as this sounds like the plot for a soap opera, all of these questions fit into a single lesson on genetics. Scholars read about three...
Odell Education
Building Evidence-Based Arguments: "Cuplae poena par esto: Let the punishment fit the crime."
Should a criminal's punishment match the crime? An argumentative writing plan explores this question as class members investigate a variety of mixed-medium sources by experts in the field, form evidence-based claims, and support them...
National Endowment for the Humanities
David Walker vs. John Day: Two Nineteenth-Century Free Black Men
What was the most beneficial policy for nineteenth-century African Americans: to stay in the United States and work for freedom, or to immigrate to a new place and build a society elsewhere? Your young historians will construct an...
Towson University
Looking Backwards, Looking Forward
How do scientists know what Earth's climate was like millions of years ago? Young environmental scholars discover how researchers used proxy data to determine the conditions present before written record. Grouped pupils gain experience...
New York State Education Department
English Language Arts Examination: June 2017
Plants prefer classical music to rock and roll. That's one of the claims in an informational passage that makes up part of a set of standardized assessment questions. The set is part of a larger collection of English language arts tests...
University of North Carolina
Statistics
Let's see you back it up! As shown in the 18th handout in the Writing the Paper series of 24 lessons from UNC, statistics help form an effective argument. The handout discusses how to analyze a source and break down the data to ensure it...
National Endowment for the Humanities
The Creation of the Bill of Rights: “Retouching the Canvas”
While the Constitutional Convention lay the foundation of the new government for the United States, the protections given under the Bill of Rights were controversial. Using documents, such as James Madison's and Thomas Jefferson's...
University of North Carolina
Art History
Art analysis might help uncover some of life's most puzzling questions, such as the mystery behind Mona Lisa's smile. The handout, from the Writing for Specific Fields series, is particularly useful for those interested in pursuing art...
Jamestown-Yorktown Foundation
Making a Patriot Inquiry: Are Independence, Freedom, and Liberty the Same Thing?
As part of a study of the American Revolution, class members engage in an inquiry-based lesson that has them watch a scene from the play Slave Spy, examine multiple primary source documents, and then discuss the similarities and...
Statistics Education Web
How High Can You Jump?
How high can your pupils jump? Learners design an experiment to answer this question. After collecting the data, they create box plots and scatter plots to analyze the data. To finish the instructional activity, they use the data to...
Statistics Education Web
The United States of Obesity
Mississippi has both the highest obesity and poverty rate in the US. Does the rest of the data show a correlation between the poverty and obesity rate in a state? Learners tackle this question as they practice their skills of regression....
Space Awareness
A View From Above
Analyzing and interpreting satellite data takes knowledge and patience. Through a detailed lab investigation, young scholars learn the process of analyzing this data. They use technology to create color images and maps from real...
EngageNY
Describing the Center of a Distribution Using the Median
Find the point that splits the data. The lesson presents to scholars the definition of the median through a teacher-led discussion. The pupils use data lists and dot plots to determine the median in sets with even and odd number of data...
American Statistical Association
Scatter It! (Predict Billy’s Height)
How do doctors predict a child's future height? Scholars use one case study to determine the height of a child two years into the future. They graph the given data, determine the line of best fit, and use that to estimate the height in...
American Statistical Association
Chocolicious
To understand how biased data is misleading, learners analyze survey data and graphical representations. They use that information to design their own plans to collect information on consumer thoughts about Chocolicious cereal.
American Statistical Association
Bubble Trouble!
Which fluids make the best bubbles? Pupils experiment with multiple fluids to determine which allows for the largest bubbles before popping. They gather data, analyze it in multiple ways, and answer analysis questions proving they...
American Statistical Association
EllipSeeIt: Visualizing Strength and Direction of Correlation
Seeing is believing. Given several bivariate data sets, learners make scatter plots using the online SeeIt program to visualize the correlation. To get a more complete picture of the topic, they research their own data set and perform an...


