Shodor Education Foundation
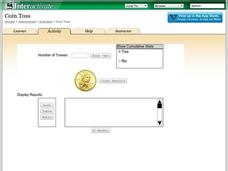
Coin Toss
Are your young mathematicians having a hard time making heads or tails of probabilities? It's no toss up—here is a resource that's sure to straighten them out! Learners run the interactive to toss a coin a different number of times....
EngageNY
Modeling an Invasive Species Population
Context makes everything better! Groups use real data to create models and make predictions. Classmates compare an exponential model to a linear model, then consider the real-life implications.
Bowland
Public Transport
"Statistics is the grammar of science" -Karl Pearson. In the assessment task, learners read a claim made by a newspaper and analyze its conclusions. They need to think about the sample and the wording of the given statistics.
101 Questions
Joulies
Does your coffee get too cold too fast? Joulies just might be your answer! Learners use experimental data to make a conclusion about how effective Joulies are at keeping coffee at the ideal temperature. A video shows the graph of the...
Math Drills
Valentine's Day Ordering and Comparing (B)
Discover this Valentine's Day-themed worksheet where young mathematicians answer word problems using data tables.
Techbridge Curriculum
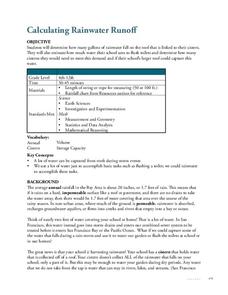
Calculating Rainwater Runoff
Thirsty plants soak up every bit of a rainfall, but what happens to the rain that hits the roof? Calculate the amount of rainwater from your school's roof with an Earth science activity, which brings measurement skills, observation...
Radford University
Can I Create a Line/Curve of Best Fit to Model Water Drainage?
Learners collect data on the amount of water left in a bottle over time. They graph the data to determine whether the scatter plot shows a curved or straight relationship. Group members then determine an equation for the curve of best...
Curated OER
Trash to Gas
Middle schoolers experiment with biomass materials as alternative energy sources. In this biomass material lesson, students participate in an experiment with cow manure to determine how it can be used as an energy source. They record...
Achieve
Ivy Smith Grows Up
Babies grow at an incredible rate! Demonstrate how to model growth using a linear function. Learners build the function from two data points, and then use the function to make predictions.
PBL Pathways
Total Cost to Produce the Turbo Blender
Class members blend their knowledge of functions and problem-solving skills to provide business advice to the Turbo Blender manufacturers. Through a project-based approach, learners examine marginal cost data to produce a function. They...
Curriculum Corner
Chrysanthemum: Name Graphing
Let's graph the amount of letters in everyone's name in the class. Give the two-page sheet to class members to collect letter data and then translate their data into a graph.
Balanced Assessment
Movie Survey
Movie preferences will get your classes talking! Individuals read a pie graph and construct a bar graph using the same information. They then answer questions specific to the data and sample size.
EngageNY
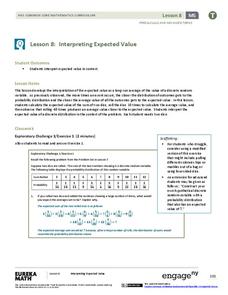
Interpreting Expected Value
Investigate expected value as a long-run average. The eighth installment of a 21-part module has scholars rolling pairs of dice to determine the average sum. They find aggregate data by working in groups and interpret expected value as...
CK-12 Foundation
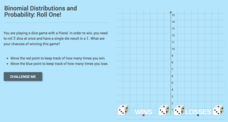
Binomial Distributions and Probability: Roll One!
It takes exactly one to win. Pupils calculate the probability of rolling five dice and having only a single die come up with a one. Learners calculate the number of expected wins out of a series of games. The interactive provides...
CK-12 Foundation
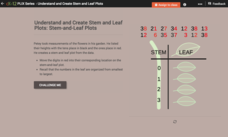
Understand and Create Stem-and-Leaf Plots: Stem-and-Leaf Plots
Explore the advantages to using a stem-and-leaf plot using an online lesson. Learners manipulate an animation to create a stem-and-leaf plot. They then calculate statistics for the data using their display. Guiding questions help them...
Texas Instruments
Sands of Time
Twelfth graders explore an application of integration. A calculus lesson prompts class members to find the length of the day where they live during the winter and summer solstice. Using data relating to the solstices at various...
American Statistical Association
Spinners at the School Carnival (Equal Sections)
Spin to win a toy car. A fun activity has pupils use a spinner in which three of the equal sections represent winning a toy car, and the fourth section represents no car. They record the number of wins after certain numbers of spins,...
National Security Agency
Go One-on-One with Decimals
Shoot and score with three basketball-themed lessons about decimals. Young mathematicians compare game statistics, make trash can hoops, and play a data spinner game to practice identifying digits and values within decimal numbers.
Mascil Project
Epidemics: Modelling with Mathematics
The Black Death epidemic is responsible for more than one million deaths in the United Kingdom. An inquiry-based activity has young scholars explore the rate of disease spread. They then analyze graphs showing data from epidemics such as...
Ed Migliore
Linear Equations in Two Variables
This traditional textbook style unit includes vocabulary, a direct explanation section, examples, practice problems that directly line up with the explanations and examples, and a unit summary review and practice problems. Learners get...
Chymist
The Solubility of a Salt in Water at Various Temperatures
An educational instructional activity allows young chemists to test the solubility of different types of salt at various temperatures. Groups create a graph using data from unsaturated, saturated, and supersaturated solutions.
Curated OER
Range, Mean, Median, Mode
Students research the impact of craters. In this range, mean, median and mode lesson, students complete an experiment with a marble to simulate the effects of a crater. Students collect and analyze data finding the range, mean, median...
Curated OER
Graphing Stories Ice Breaker
Kick off the school year with some math fun! New classmates share information about themselves by using graphs and interpreting data. The goal is to use a general graph shape, such as linear or exponential, and create labels for the axes...
Curated OER
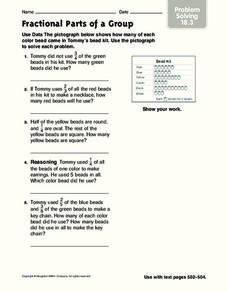
Fractional Parts of a Group
In this problem solving worksheet, students problems solve the answers to 5 mathematical word problems involving fractional parts. Students use data from a pictograph to assist them in solving each word problem.


