Illustrative Mathematics
Identifying Graphs of Functions
Match the graph with its function in an exercise that focuses on variations of the graph of y = e^x. Learners are given four graphs on the same set of axes and four functions, all involving e^x. The task is to match each function with...
Illustrative Mathematics
Comparing Speeds in Graphs and Equations
Compare two different proportional relationships on a graph. It is up to your mathematicians to determine which of two moving objects have greater speed. A good example of a Common Core multiple choice question.
Illustrative Mathematics
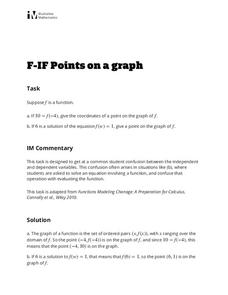
Points on a Graph
Learners practice using their knowledge of how to interpret a function and use function notation. The activity includes two questions. Given an input of a function and its output, the first question asks learners to write the ordered...
Illustrative Mathematics
Identifying Graphs of Functions
Take a matching problem and take challenging exponential graphs and combine to make one thought-provoking question. Learners look at four higher level exponential functions to match to the four graphs placed together. The equations and...
Inside Mathematics
Sorting Functions
Graph A goes with equation C, but table B. The short assessment task requires class members to match graphs with their corresponding tables, equations, and verbalized rules. Pupils then provide explanations on the process they used to...
Illustrative Mathematics
Identifying Quadratic Functions (Vertex Form)
Pupils calculate the equation of a quadratic in vertex form from a specific graph and determine an equation that would fit the description of a parabola. The final question determines the individuals' understanding of the signs of the...
Balanced Assessment
All Aboard
Pupils must graph the location of a train using the time given a timetable. They analyze the different legs of the trip, graph the return trip, and compare the two graphs. The lesson ends with a discussion of similarities and differences...
Noyce Foundation
Granny’s Balloon Trip
Take flight with a fun activity focused on graphing data on a coordinate plane. As learners study the data for Granny's hot-air balloon trip, including the time of day and the distance of the balloon from the ground, they practice...
Inside Mathematics
Squares and Circles
It's all about lines when going around. Pupils graph the relationship between the length of a side of a square and its perimeter. Class members explain the origin in context of the side length and perimeter. They compare the graph to the...
Concord Consortium
People and Places
Graph growth in the US. Given population and area data for the United States for a period of 200 years, class members create graphs to interpret the growth over time. Graphs include population, area, population density, and population...
Mathematics Assessment Project
Sorting Functions
There's no sorting hat here. A high school assessment task prompts learners to analyze different types of functions. They investigate graphs, equations, tables, and verbal rules for four different functions.
EngageNY
Nature of Solutions of a System of Linear Equations
If at first you cannot graph, substitute. The lesson introduces the substitution method as a way to solve linear systems if the point of intersection is hard to determine from a graph. The 28th installment of a 33-part series finishes...
Mathematics Assessment Project
Shelves
Don't leave this task on the shelf — use it is assess middle schoolers understanding of patterns. Participants try to discover a pattern in the number of bricks and planks used to make shelves. They then match descriptions and equations...
Balanced Assessment
Time Line
Use a graph to tell a story! Given a graph, young scientists create a story to match. They must provide their own axes labels and description of the scenario. The graph has increasing, decreasing, and constant sections.
Inside Mathematics
Party
Thirty at the party won't cost any more than twenty-five. The assessment task provides a scenario for the cost of a party where the initial fee covers a given number of guests. The class determines the cost for specific numbers of guests...
Balanced Assessment
Dollar Line
Challenge the class to develop a story that matches a graph. The short assessment provides a line graph with the vertical axis labeled as dollars. The task asks pupils to develop a description of a situation that could be represented by...
Concord Consortium
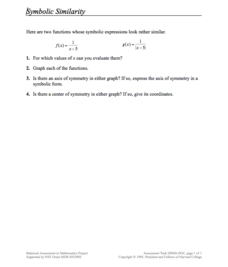
Symbolic Similarity
How many things does one transformation tell you? Learners compare and contrast the graphs of different parent functions with the same transformation. Using a rational and absolute value function, pupils identify key features of their...
Balanced Assessment
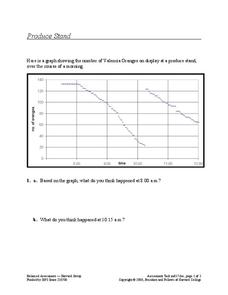
Produce Stand
Interpret a graph of the number of oranges at a produce stand to determine a likely event at different times. They also analyze the graph to determine which time period oranges were selling most quickly.
Illustrative Mathematics
Latitude
The greater the latitude, the less of the Earth is north. Scholars graph the relationship between the latitude and the percentage of the Earth that is north of the latitude. Using the graph and the table, class members interpret values...
Concord Consortium
Crossing the Axis
Mathematicians typically reference eight different types of functions. Scholars learn about the requirements for graphing a function and must decide how many different functions fit. To finish, they define each specific function meeting...
Mathematics Assessment Project
College and Career Readiness Mathematics Test A1
A six-page test covers content from several different high school math courses. It incorporates a few short answer, graphing, and word problems. It also allows room for mathematical reasoning and analysis.
Mathed Up!
Inequalities Regions
Discover how to solve systems of inequalities by graphing. An informative video shows pupils how to determine the solution set after graphing each inequality of a system. To finish, a worksheet gives them a chance to practice this skill.
Illustrative Mathematics
Foxes and Rabbits 2
The fox population chases the rabbit population. Groups model the populations of foxes and rabbits with two trigonometric functions. Individuals graph both trigonometric models on the same graph, and then teams determine an explanation...
Concord Consortium
Functions by the Slice
Piece by piece ... dismantling a function can highlight interesting patterns. The task asks learners to slice functions in sections with the same vertical change. They then recreate the graph with these slices positioned horizontally....
Other popular searches
- Coordinate Graphing Pictures
- Graphing Ordered Pairs
- Graphing Skills Lesson Plans
- Coordinate Graphing
- Graphing Linear Equations
- Holiday Coordinate Graphing
- Graphing Linear Inequalities
- Graphing Calculator
- Graphing Inequalities
- Halloween Math Graphing
- Graphing Mean, Median, Mode
- Graphing Data


