Concord Consortium
Calculator Numbers
Know thy calculator. Young mathematicians use their calculators to answer a set of questions. They consider how the number of digits the calculator displays affects the answers to calculations. They then find examples of computations...
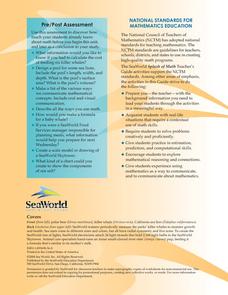
Sea World
Splash of Math
How can kids use math to learn about marine life? Combine math skills with science lessons in a resource featuring activities about life in the sea. Kids graph and calculate data, solve complex word problems, measure geometric shapes,...
University of Missouri
Money Math
Young mathematicians put their skills to the test in the real world during this four-lesson consumer math unit. Whether they are learning how compound interest can make them millionaires, calculating the cost of remodeling...
Baylor College
Food: The Math Link
Enrich your study of food science with with these math worksheets. They offer a variety of food-related word problems that are great practice for multiplying, identifying fractions, estimating length, and performing calculations...
Georgia Department of Education
Math Class
Young analysts use real (provided) data from a class's test scores to practice using statistical tools. Not only do learners calculate measures of center and spread (including mean, median, deviation, and IQ range), but...
Council for Economic Education
Calculating Simple Interest
How much is owed? A calculated resource introduces the simple interest formula with a video that describes how to use it. Classmates then show what they know by answering questions within a simple interest worksheet.
EngageNY
Calculating Conditional Probabilities and Evaluating Independence Using Two-Way Tables (part 1)
Being a statistician means never having to say you're certain! Learners develop two-way frequency tables and calculate conditional and independent probabilities. They understand probability as a method of making a prediction.
Techbridge Curriculum
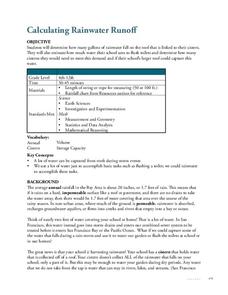
Calculating Rainwater Runoff
Thirsty plants soak up every bit of a rainfall, but what happens to the rain that hits the roof? Calculate the amount of rainwater from your school's roof with an Earth science activity, which brings measurement skills, observation...
CK-12 Foundation
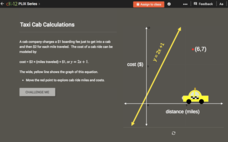
Checking Solutions to Equations: Taxi Cab Calculations
Ride to success in checking solutions to equations. Scholars use an interactive graph to identify points that are solutions to a linear equation. Interpreting these points in terms of the context completes the activity.
Mrs. Burke's Math Page
Let Them Eat Pi
Looking for a fun and creative way to celebrate Pi Day? Then this is the resource for you. From a scavenger hunt and trivia contest to PowerPoint presentations and skills practice worksheets, this collection of materials is a...
Curated OER
All About Money
Few topics engage young mathematicians as much as learning about money. Through a series of shared readings and hands-on activities, children explore the US currency system, learning how to count money and calculate change as they create...
Curated OER
Button Bonanza
Collections of data represented in stem and leaf plots are organized by young statisticians as they embark some math engaging activities.
Federal Reserve Bank
Sky Boys: How They Built the Empire State Building
How tall is the Empire State Building? Lead your class through a collaborative estimation activity to determine the number of quarters it would take to reach the top and teach the following concepts: human capital, human resources,...
Virginia Department of Education
Exploring 3-D Geometry
Take young mathematicians on an exploration of the world of 3-D geometry with this seven-lesson unit. After first defining the terms perimeter, area, and volume and how they apply to the real world, students continue on...
Curated OER
Math Games for Skills and Concepts
A 27-page packet full of math games and activities builds on algebra, measurement, geometry, fractional, and graphing skills. Young mathematicians participate in math games collaboratively, promoting teamwork and skills practice.
EngageNY
Graphs of Linear Functions and Rate of Change
Discover an important property of linear functions. Learners use the slope formula to calculate the rates of change of linear functions. They find that linear functions have constant rates of change and use this property to determine if...
Baylor College
Global Atmospheric Change: The Math Link
Change up the classroom atmosphere with this interdisciplinary resource. Following along with the children's book Mr. Slaptail's Curious Contraption, these math worksheets provide practice with a wide range of topics including...
PBS
Working with Coordinate Planes: Activities and Supplemental Materials
Seven activities make up a collection of supplemental materials to reinforce graphing on a coordinate plane. Worksheet objectives include plotting coordinates within single and four quadrants, measuring straight and...
EngageNY
Modeling a Context from Data (part 2)
Forgive me, I regress. Building upon previous modeling activities, the class examines models using the regression function on a graphing calculator. They use the modeling process to interpret the context and to make predictions...
EngageNY
Modeling with Polynomials—An Introduction (part 1)
Maximizing resources is essential to productivity. Class members complete an activity to show how math can help in the process. Using a piece of construction paper, learners construct a box with the maximum volume. Ultimately, they...
Curated OER
Interpret Clock Time
Save yourself a few minutes of planning with this elementary math lesson plan on elapsed time. Through a series of collaborative and independent learning activities, children explore different real-world situations as they learn how to...
EngageNY
More on Modeling Relationships with a Line
How do you create a residual plot? Work as a class and in small groups through the activity in order to learn how to build a residual plot. The activity builds upon previous learning on calculating residuals and serves as a...
Prince William Network
Migration Math Madness
A great way to incorporate math into life science, this instructional activity has learners measure migratory routes on a map and calculate the actual distance that shorebirds on the routes would cover. Learners compute the distance...
Illustrative Mathematics
How Many Buttons?
Bring the class into the probability by having everyone count buttons on their shirts. Organize the data into the chart provided and chose different possibilities such as "female with one button" or "all learners with more than four...

