Illustrative Mathematics
Fruit Salad
Playing with values in this fruit salad problem allows learners to find out how many cherries were mixed in. Your middle schoolers can organize their thoughts in a chart before going into the equation. Eigth graders can skip the chart...
Teach Engineering
The Challenge Question
A research position becomes a modeling job. The introductory lesson in a series of nine presents the challenge of analyzing a set of bivariate data. The class brainstorms what the data may represent. Pupils must decide what is needed to...
Curated OER
What Functions do Two Graph Points Determine?
Your algebra learners write linear, exponential, and quadratic equations containing the same two graph points in this collaborative task.
Radford University
Pizza, Pizza!
Ponder the problem of pizza prices. Pupils use provided information about two different pricing schedules for pizza. They create tables of values and functions to represent the pricing schemes, consider domain restrictions, and identify...
Mt. San Antonio Collage
Test 1: Functions and Their Graphs
Save the time creating an assessment because these function problems should do the trick. With 10 multi-part questions, they each focus on a different topic including radical, polynomial, linear and piecewise functions. The majority of...
Statistics Education Web
NFL Quarterback Salaries
Use statistics to decide if NFL quarterbacks earn their salaries! Learners study correlation coefficients after using technology to calculate regression equations. Through the data, they learn the meaning of correlation and correlation...
Education Development Center
Creating a Polynomial Function to Fit a Table
Discover relationships between linear and nonlinear functions. Initially, a set of data seems linear, but upon further exploration, pupils realize the data can model an infinite number of functions. Scholars use multiple representations...
NASA
Lights on the International Space Station
Groups explore illumination with NASA's Lighting Environment Test Facility (LETF) as a context. Using the TI-Nspire app, groups determine the lux equation that models their simulation. They then use the lux equation to solve problems...
Mathematics Vision Project
Features of Functions
What are some basic features of functions? By looking at functions in graphs, tables, and equations, pupils compare them and find similarities and differences in general features. They use attributes such as intervals of...
Illustrative Mathematics
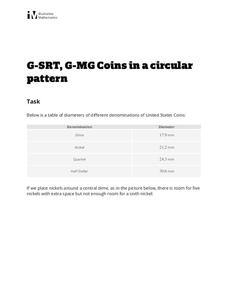
Coins in a Circular Pattern
What starts as a basic question of division and remainders quickly turns abstract in this question of related ratios and radii. The class works to surround a central coin with coins of the same and different values, then develops a...
National Research Center for Career and Technical Education
Break-Even Point
How do companies determine the prices of their products? Marketing maestros discover the concepts of cost and break-even point through discussion, independent practice, and a collaborative assessment. The career and technology-oriented...
Illustrative Mathematics
High School Graduation
An exercise in finding the approximate time that a name would be called at a graduation. Estimating time may be difficult for some of the class, so this resource would not be a good choice for learning this standard. It does end with a...
American Statistical Association
What Fits?
The bounce of a golf ball changes the result in golf, mini golf—and a great math activity. Scholars graph the height of golf ball bounces before finding a line of best fit. They analyze their own data and the results of others to better...
Teach Engineering
Edible Rovers (High School)
Design and build a rover ... then eat it? This activity has groups of two design and build Mars rovers. The teams determine what instruments they want to include with their rover and plan a budget. They calculate the cost of the body of...
EngageNY
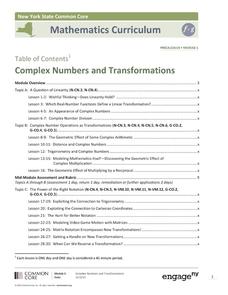
Complex Numbers and Transformations
Your learners combine their knowledge of real and imaginary numbers and matrices in an activity containing thirty lessons, two assessments (mid-module and end module), and their corresponding rubrics. Centered on complex numbers and...
Radford University
Movie Projector Cost
Small groups analyze the attendance at a movie theater and determine the amount of money made for per show. Team members calculate the number of shows it would take for a theater to make a profit after purchasing a new digital projector....
Radford University
Green Cravings
Build up a bag of green. Pupils determine the number of green Skittles in a snack bag and come up with a way to determine how many snack bags it would take to create one bag of only green Skittles. Classmates share their methods and...
101 Questions
Two Lane Road
Two vehicles move at a constant rate of speed toward each other, but when exactly will they pass? Pupils use still images from a video to determine the rate of speed and when the two cars meet. Then, they watch the complete video to...
Virginia Department of Education
Exponential Modeling
Investigate exponential growth and decay. A set of six activities has pupils collecting and researching data in a variety of situations involving exponential relationships. They model these situations with exponential functions and solve...
Curated OER
Logarithmic Functions
Learners explore the characteristics of logarithmic functions and their relationship to exponential functions. Using the subscriber website Explorelearning.com, pupils observe changes in the input variable and its effect on the graph of...
Curated OER
Stochastic and Deterministic Modeling
Explore the difference between stochastic and deterministic modeling through programming. First have the class write algorithms for relatively simple tasks using pseudocode. Use the Python 2.7 program app to simulate Mendel's Pea Pod...
Virginia Department of Education
Logarithmic Modeling
Explore logarithms and logarithmic regression. Young mathematicians first learn about inverse functions and about the logarithm function family. They take their newfound knowledge to use logarithmic functions to model situations and...
Virginia Department of Education
Quadratic Curve of Best Fit
Class members create a table of the number of chords that can be drawn given the number of points on a circle. Pupils analyze the data created, find a function to fit to it, and use the function to make further predictions.
Curated OER
Pi Day: The Other Math Holiday!
Happy Pi Day! This collection of games, experiments, and activities leads participants through an exploration of the many aspects and attributes of that mysterious quantity, pi. Activities range from using statistical experimentation to...


