US Department of Commerce
Featured Activity: Population Change Over Time
Keep track of a state's population. After a brief discussion on how population data is used for funding, individuals look at population changes over time. Pupils find the population of two states using three different censuses. They then...
Science 4 Inquiry
The Ups and Downs of Populations
As the reality of population decline across many species becomes real, pupils learn about the variables related to changes in populations. They complete a simulation of population changes and graph the results, then discuss limiting...
Curated OER
Bacteria Populations
Your young microbiologists will interpret and solve exponential equations in this real-world context task set in a hospital research scenario. Learners think in terms of the functions as well as their rates of change.
Curated OER
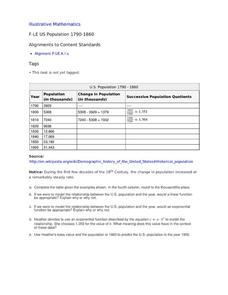
US Population 1790-1860
Your young population scientists analyze a table of values, write a model to represent the real life data, finish the table of data and predict future populations in a collaborative, real-life activity.
EngageNY
Exponential Growth—U.S. Population and World Population
Show how exponential growth can look linear. Pupils come to understand the importance of looking at the entire picture as they compare the US population to the world population. Initially, the populations look linear with the same rate...
Skyscraper Museum
Changes in a City Over Time
Investigate the growth and development of New York City with the final lesson in this four-part series on skyscrapers. Learners first explore the concept of urban growth by looking closely at a series of three paintings made of Wall...
Curated OER
In the Billions and Exponential Modeling
Modeling population growth gives learners an opportunity to experiment with real data. Comparing the growth rates in this real-life task strengthens learners' understanding that exponential functions change by equal factors over equal...
Shodor Education Foundation
Rabbits and Wolves
A change in a parameter can end in overpopulation. The resources gives pupils the opportunity to control the parameters of rabbits and wolves in a natural setting. Using the set parameters, the simulation runs and displays the population...
EngageNY
Graphs of Exponential Functions
What does an exponential pattern look like in real life? After viewing a video of the population growth of bacteria, learners use the real-life scenario to collect data and graph the result. Their conclusion should be a new type of...
Population Connection
Where Do We Grow from Here?
Did you know that the population is expected to grow to 11 billion by 2100? The resource serves final installment in a six-part series on the global population and its effects. Scholars interpret data from the United Nations about the...
Population Connection
The Carbon Crunch
Carbon is in the air; should we care? Teach the class why it is important to pay attention to carbon levels and how the world population and various countries across the globe affect the carbon levels in the atmosphere. High schoolers...
Virginia Department of Education
A-Mazing Plants
Have your young scientists questioned why plants grow a particular way? Through this learning opportunity, scientists gain firsthand knowledge about how plants develop and various factors that affect rates of growth as they bring plants...
Curated OER
US Population 1982-1988
Your algebra learners make predictions using the concepts of a linear model from real-life data given in table form. Learners analyze and discuss solutions without having to write a linear equation.
Curated OER
In the Billions and Linear Modeling
Your learners analyze population data to discern if it best fits a linear scenario. The idea of change by equal differences over equal intervals is enforced in this real-life task.
Curated OER
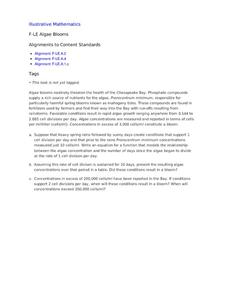
Algae Blooms
Your microbiologists explore a changing algae population and build an exponential function modeling algae concentration from the description given of the relationship between concentrations in cells/ml and days of rapid growth.
Population Connection
A Demographically Divided World
Did you know that birth and life rates vary across the world? The resource, the second in a six-part series, discusses just how demographics differ across countries and why it might be the case. Scholars complete worksheets, watch...
PricewaterhouseCoopers
Waste and Recycling: Recycling and Energy Recovery
Reduce, reuse, recycle, and recover. Young environmentalists learn about the overwhelming amount of garbage produced and discover better ways to minimize their impact on Earth by learning the difference between garbage and...
Mathematics Vision Project
Module 4: Linear and Exponential Functions
Sequences and series are traditionally thought of as topics for the pre-calculus or calculus class, when learners are figuring out how to develop limits. But this unit uses patterns and slopes of linear functions in unique ways...
Curated OER
Pocumtucks in Deerfield
As part of a study of colonial and Native American history, class members focus on the beliefs and land use of the Pocumtucks, who settled near Deerfield, Massachusetts. Students examine their beliefs about land use and ownership, the...
Library of Congress
Industrial Revolution
Could you live without your phone? What about cars, steel, or clothing? Class groups collaborate to produce presentations that argue that either the telephone, the gramophone, the automobile, the textile industry, or the steel...
Alabama Learning Exchange
Nature's Life Cycle
Become a member of the Pollution Patrol and stand up to litter! After discussing the life cycle of seeds and discussing how plants figure into the food chain, young conservationists engage in several activities involving podcasts,...


