American Chemical Society
Density of Water
We know solids have a density we can measure, but what about liquids? Lesson explores this concept and allows scholars to explore the relationship between volume and density. Graphing and analysis questions round out the activity.
Montana State University
What's the Weather?
How many jackets do you need to stay warm and climb Mount Everest? An informatie resource covers the topic of Mount Everest, the resource helps young scientists discover the difference between climate and weather. Activities include...
National Wildlife Federation
Get Your Techno On
Desert regions are hotter for multiple reasons; the lack of vegetation causes the sun's heat to go straight into the surface and the lack of moisture means none of the heat is being transferred into evaporation. This concept, and other...
Curated OER
Youth Obesity: Schools Fight Back
Explore nutrition and healthy eating habits with a study on youth obesity. Learners watch a PBS documentary on the obesity epidemic which discusses government programs aimed at healthier choices, as well as more localized efforts. Kids...
Curated OER
Games on Echolocation
Get a little batty with life science! This fun simulation game replicates how bats use echolocation to hunt moths in their native Hawaiian habitat. After creating blind folds and discussing some basic principles of echolocation, students...
West Contra Costa Unified School District
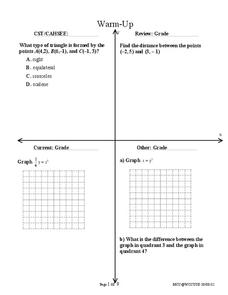
Conics Introduction and Parabolas
Where did conic sections get their name? The equation and graph of a parabola are developed from the definition of the conic section. Teacher examples on graphing the equation and writing an equation from the graph round out the plan.
Learner
Solid Shapes
A collection of two lessons, kindergartners will identify two-dimensional shapes in solid shapes. They will develop basic knowledge of the components that make up a sphere, rectangular prism, pyramid, cylinder, cone, and cube. Young...
Mt. San Antonio Collage
Quiz 2: Polynomials
Four questions that get right to the polynomial point. High schoolers list all the attributes of a polynomial function, including finding all complex zeros. The last two questions prompt them to write a function based on the given zeros...
Mt. San Antonio Collage
Quiz 1: Functions, Domain and Range
Take the work out of worksheets and use these problems and worked-out answer key as a resource. The problems reinforce skills in domain and range, identifying graphs, and even and odd functions.
Mascil Project
House Insulation
Make sure your house is warm in the winter. Pupils analyze graphs of heating costs for two similar houses and make hypotheses for why the costs differ. They then build models of houses with appropriate insulation to reduce heating costs.
Workforce Solutions
Miniature Gulf Coast Project
Scholars show what they know about data collection and analysis with an activity that examines a smaller population of Houghton, Texas. Independently or in pairs, learners identify their research question, gather, graph, and analyze...
Curated OER
After Reading: "Plot the Plot" Activity in the Library Media Class
"Plot the plot" of "The Adventures of the Speckled Band" with your young readers. Take a few days to read Sir Arthur Conan Doyle's short story as a class or in pairs, having learners write down what they consider to be the most important...
Shmoop
ELA.CCSS.ELA-Literacy.SL.9-10.2
What are diverse media formats? Have your class figure this out on their own through small-group brainstorming. The resource includes two related activities about different kinds of data that will help your class get a grasp of media...
National Wildlife Federation
Wherefore Art Thou, Albedo?
In the sixth lesson in a series of 21, scholars use NASA data to graph and interpret albedo seasonally and over the course of multiple years. This allows learners to compare albedo trends to changes in sea ice with connections to the...
Baylor College
Heart and Lungs
With a partner, youngsters measure their pulse and breathing rates, both at rest and after running in place for a minute. While this activity is not novel, the lesson plan includes a large-scale classroom graphing activity and other...
Texas State Energy Conservation Office
Investigation: Gas Laws in Action - Propane
Using helium as an example of propane, physical science middle schoolers experiment with and graph the relationship between temperature and volume in gases. In a whole-class demonstration, they show how molecules behave under different...
EngageNY
Four Interesting Transformations of Functions (Part 1)
Understanding how functions transform is a key concept in mathematics. This introductory instructional activity makes a strong connection between the function, table, and graph when exploring transformations. While the resource uses...
EngageNY
Four Interesting Transformations of Functions (Part 3)
Continue the study of transformations with an examination of horizontal stretches, shrinks, and reflections. Individuals use the same process used in parts one and two of this series to examine horizontal changes. The resource also...
Science 4 Inquiry
The Ups and Downs of Populations
As the reality of population decline across many species becomes real, pupils learn about the variables related to changes in populations. They complete a simulation of population changes and graph the results, then discuss limiting...
Howard County Schools
Drawing Inverses
An Algebra II lesson draws the connection between the exponential function and its inverse. By graphing an exponential function and using tables and a calculator, young scholars graph the logarithmic function. The plan comes with a...
EngageNY
Modeling a Context from Data (part 2)
Forgive me, I regress. Building upon previous modeling activities, the class examines models using the regression function on a graphing calculator. They use the modeling process to interpret the context and to make predictions based...
Illustrative Mathematics
Fixing the Furnace
This comprehensive resource applies simultaneous equations to a real-life problem. Though the commentary starts with a graph, some home consumers may choose to begin with a table. A graph does aid learners to visualize the shift of one...
National Wildlife Federation
Hot, Hotter, Hottest: Extreme Weather's Impact on Our Resources
How dry is it? It's so dry, the river only runs twice a week! Through an analysis of maps and discussions, pairs learn about droughts across the United States in the ninth of 12 lessons. They then read about, answer questions, analyze...
American Statistical Association
Bear Hugs
Scholars research arm span to determine who gives the best bear hugs. They use data from a national study to find the standard statistics for arm span. It includes mean, median, quartiles, spread, standard deviation, and more.
Other popular searches
- Graphing Skills Lesson Plans
- Basic Graphing Skills
- Organizing and Graphing Data
- Introducing Graphing Skills
- Graphing Skills Using M&ms
- Graphing Skills in Science
- Graphing Skills for Prek
- Graphing Skills With Fruits
- Graphing Skills in Chemistry
- Graphing Skills for Perk
- Graphing Skills Worksheet
- Reading Graphing Skills


