Hi, what do you want to do?
CCSS Math Activities
Smarter Balanced Sample Items: 6th Grade Math – Claim 3
Communication is key. Eight sample items show how important communication and reasoning is for sixth grade mathematics. Part of the Claim 2-4 slide show series, the presentation uses concepts from fifth and sixth grade to illicit...
Mathed Up!
Compound Measures
Compounding is dividing units. Pupils practice using compound measures such as units for speed and density to solve problems that range from straightforward speed problems to those requiring conversions. The last few items challenge...
Physics Classroom
What's Up (and Down) with KE and PE
Physics class has its ups and downs ... especially when it involves energy concepts! Scholars analyze information to determine changes in kinetic and potential energy using an interactive resource. Realistic scenarios make connecting...
CK-12 Foundation
Angular Velocity: 200 Meter Dash
Do curves slow runners down or help their speed? Pupils simulate a 200-meter dash to calculate the angular and linear velocity of a runner. They then determine whether the runner is faster around the curved section of the track...
EngageNY
Problem Solving Using Rates, Unit Rates, and Conversions
Find a way to work with rates. The 23rd part in a 29-part series presents work problems for the class to solve given work rates. Pupils compare rates to determine which is faster. Some problems require learners to convert the rates to...
EngageNY
Getting the Job Done—Speed, Work, and Measurement Units II
How fast is your class? Learners determine the amount of time it takes individuals to walk a given distance and calculate their speeds. Pupils solve distance, rate, and time problems using the formula and pay attention to the...
Balanced Assessment
Ford and Ferrari
Which is faster, a Ford or a Ferrari? The short assessment has pupils analyze graphs to determine the rates of change between the two. Individuals interpret the rates of change within the context of speeds of the cars and develop a map...
EngageNY
The Concept of a Function
Explore functions with non-constant rates of change. The first installment of a 12-part module teaches young mathematicians about the concept of a function. They investigate instances where functions do not have a constant rate of change.
Balanced Assessment
A Run for Two
Develop a graph to represent the distance between two cars. The assessment task presents a scenario in which two cars are traveling at constant speeds with one faster than the other. Pupils develop graphical representations to show the...
InqueryPhysics
Interpreting Motion Graphs
Every movement in the world can be measured and even motionless objects can be significant indicators of movement. Focus on motion graphs that feature distance vs. time, speed vs. time, and positive and negative acceleration.
Broward County Public Schools
Force and Motion
Get the ball rolling with this upper-elementary science unit on forces and motion. Offering over three weeks of physical science lessons, this resource is a great way to engage the class in learning about simple machines, friction,...
Illustrative Mathematics
Walk-a-thon 1
Your mathematician's job is to explore the relationship between hours and miles walked during a walk-a-thon. The activity compels your learners to experiment with different means in finding out this proportional relationship. The answer...
Noyce Foundation
Snail Pace
Slow and steady wins the race? In the assessment task, scholars calculate the rates at which different snails travel in order to find the fastest snail. Hopefully, your class will move much more quickly in finishing the task!
Curated OER
Comparing Distance/Time Graphs to Speed/Time Graphs
In this graphing the motion of objects worksheet, students compare graphs of distance vs. time and speed vs. time of objects moving at constant speed, accelerating, slowing down, and stopped. Students identify the movement of a car given...
Curated OER
Weight, Friction, Equilibrium
In this weight learning exercise, students review the equation for solving for the force of weight and review the kinds of friction. Students complete 10 matching, 7 fill in the blank, and 8 problems to solve.
Curated OER
Bug Race
In this motion worksheet, students compare two graphs showing a bug's distance traveled over time. Students calculate the average speed of the bugs and determine which bug was traveling at a constant speed. This worksheet has 1 short...
Curated OER
Position vs. Time and Velocity vs. Time Graphs
For this constant velocity worksheet, students use data of position vs. time of a roller-skater to determine speed, acceleration, or deceleration at different points along the path. Students rank graphs according to average velocity and...
Curated OER
Hot Wheelin' Physics
In this physics worksheet, students complete a lab activity and record their results in the charts shown. They calculate the speed for each trial using the total time and total distance. Students also graph their results.
Curated OER
Historical Perspectives
Twelfth graders watch episodes of Star Trek and analyze the works of it that pertain to the theory of relativity. For this creative lesson students also write and illustrate a children's book about the special theory of relativity.
Curated OER
Speed and Distance
In this speed worksheet, high schoolers create time vs. distance graphs to answer questions about average speed, average velocity, and acceleration. This worksheet has 3 problems to solve.
Curated OER
Physics Unit 8: 1
In this physics unit 8 worksheet, students construct a qualitative motion map as it relates to centripetal force of a described scenario. Students respond to questions as it relates to acceleration and the magnitude of the centripetal...
University of California
Ucla: Speed and Velocity
Discusses the meaning of velocity in terms of a graphical representation. Calculus-based discussion. Good graphics.
Texas Instruments
Texas Instruments: Walk the Line
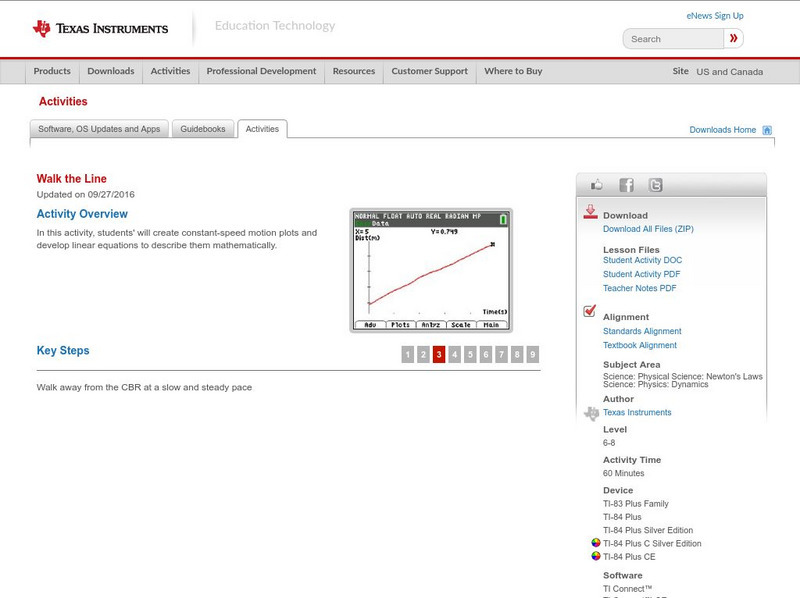
In this activity, students will create constant-speed motion plots and develop linear equations to describe them mathematically.
TED Talks
Ted: Ted Ed: The Fundamentals of Space Time: Part 3
In this third and final lesson, CERN scientists Andrew Pontzen and Tom Whyntie explore what gravity means for space-time- or rather, what space-time means for gravity. [3:27]


