College Board
2014 AP® Statistics Free-Response Questions
Turn a summative assessment into a formative assessment! The 2014 AP® Statistics exam shows learners the level of difficulty they will encounter on their end-of-course exams. Within the six items, the test highlights concepts such as...
College Board
2015 AP® Statistics Free-Response Questions
Statistics is all about making inferences. Can you infer how your pupils will fair on their AP® exams? Collect your own data by giving them practice tests such as the 2015 free-response exam. The six-question test includes topics such as...
College Board
2016 AP® Statistics Free-Response Questions
Test your classes on their knowledge of advanced statistic concepts. Young math scholars get a sneak peek at the end of course AP® statistics exam with the released items from the 2016 test. The six-question free response exam addresses...
College Board
2017 AP® Statistics Free-Response Questions
Reduce testing anxiety by helping learners prepare for test day. Scholars complete six free-response questions from a released AP® exam. The questions test a variety of concepts including confidence intervals, frequency tables,...
College Board
Sampling Distributions
The validity of data depends on the strength of the sample. A collection of instruction and activities focuses on sampling distributions and the analysis of that data. Scholars learn about distribution tests such and Central Limit...
College Board
Special Focus: Inference
Statistics is all about making inferences! A lesson guide explains the meaning of inferences and how to use statistics to make them. The resource provides instruction as well as information about the topic on the AP® Statistics exam.
Howard Hughes Medical Institute
Population Genetics, Selection, and Evolution
The Hardy-Weinberg principle states that alleles and genotypes remain constant in the absence of evolutionary influences. Scholars complete a simple hands-on activity applying the Hardy-Weinberg principle to sample data. They observe how...
CCSS Math Activities
Smarter Balanced Sample Items: High School Math – Claim 4
What is the appropriate model? Sample problems show the extent of the Smarter Balanced assessments Claim 4, Modeling and Data Analysis. Items provide pupils the opportunity to use mathematical modeling to arrive at a reasonable answer....
Howard Hughes Medical Institute
Evolution in Action: Data Analysis
An environmental factor, such as a drought, sometimes speeds up the rate of natural selection. Scholars analyze data on the beaks of birds around the time of the drought. They compare those that survived to those that perished and find...
Howard Hughes Medical Institute
Using Genetic Crosses to Analyze a Stickleback Trait
Two fish appear different, but how do scientists determine their genotypes? Scholars practice performing test crosses to determine the genotypes of fish given their phenotypes. They answer in-depth comprehension questions and complete...
Howard Hughes Medical Institute
Look Who's Coming for Dinner: Selection by Predation
What happens when a new predator comes to town? Learners analyze an experiment that studies the effect of predation on selection. They use real data to draw conclusions about the impact a new predator has on a prey species.
Mathematics Vision Project
Module 9: Statistics
All disciplines use data! A seven-lesson unit teaches learners the basics of analyzing all types of data. The unit begins with a study of the shape of data displays and the analysis of a normal distribution. Later lessons discuss the...
Social Media Toolbox
Social Media Survey
Survey says ... social media is here to stay! How do the pupils in your school use social media? Using lesson four from a 16-part series, The Social Media Toolbox, learners study surveys and create their own. The resource includes...
101 Questions
Representative Sample
At what point does data switch from being an outlier to part of the average? Scholars view conflicting news articles about protesters. They must decide which, if any, side is using the correct sample to draw their conclusions. It's a...
National Council of Teachers of Mathematics
Eruptions: Old Faithful Geyser
How long do we have to wait? Given several days of times between eruptions of Old Faithful, learners create a graphical representation for two days. Groups combine their data to determine an appropriate wait time between eruptions.
Shodor Education Foundation
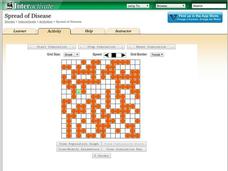
Spread of Disease
Control the spread of a contagious disease. An applet allows pupils to run a simulation on the spread of a disease. Rules govern how the disease is spread and the length of time it takes to recover. Learners view the spread visually and...
Shodor Education Foundation
Rabbits and Wolves
A change in a parameter can end in overpopulation. The resources gives pupils the opportunity to control the parameters of rabbits and wolves in a natural setting. Using the set parameters, the simulation runs and displays the population...
Shodor Education Foundation
Buffon's Needle
Find the needle on a lined paper. Pupils run a simulation of dropping a needle on a lined paper. The probability of the needle crossing at least one line is pi/2. After each trial, the interactive displays the approximation of pi based...
CK-12 Foundation
Simple Random Sampling: How Many Samples Does it Take to Change a Light Bulb?
Teach the concept of simple random sampling through an interactive lesson. Learners explore the concept by considering the strength of sampling methods. Size of the samples varies also as individuals determine which methods lead to the...
Virginia Department of Education
Exploring Statistics
Collect and analyze data to find out something interesting about classmates. Groups devise a statistical question and collect data from their group members. Individuals then create a display of their data and calculate descriptive...
American Statistical Association
An A-MAZE-ING Comparison
Teach your class how to use descriptive statistics through a hands-on data collection activity. Pupils collect their own data, calculate test statistics, and interpret the results in context. They compare male and female results, looking...
Statistics Education Web
It Creeps. It Crawls. Watch Out For The Blob!
How do you find the area of an irregular shape? Class members calculate the area of an irregular shape by finding the area of a random sampling of the shape. Individuals then utilize a confidence interval to improve accuracy and use a...
Statistics Education Web
It’s Elemental! Sampling from the Periodic Table
How random is random? Demonstrate the different random sampling methods using a hands-on activity. Pupils use various sampling techniques to choose a random sample of elements from the periodic table. They use the different samples to...
Statistics Education Web
Using Dice to Introduce Sampling Distributions
Investigate the meaning of a sample proportion using this hands-on activity. Scholars collect data and realize that the larger the sample size the more closely the data resembles a normal distribution. They compare the sample proportion...


