EngageNY
Creating a Histogram
Display data over a larger interval. The fourth segment in a 22-part unit introduces histograms and plotting data within intervals to the class. Pupils create frequency tables with predefined intervals to build histograms. They describe...
EngageNY
Creating a Dot Plot
Which dot am I? Pupils create dot plots to represent sample data through the use of frequency tables. The third segment in a series of 22 asks individuals to analyze the dot plots they created. The scholars translate back and forth...
NOAA
What Killed the Seeds?
Can a coral cure cancer? Take seventh and eighth grade science sleuths to the underwater drugstore for an investigation into emerging pharmaceutical research. The fifth installment in a series of six has classmates research the wealth of...
Noyce Foundation
Through the Grapevine
Teach statistics by analyzing raisins. A thorough activity provides lesson resources for five levels to include all grades. Younger pupils work on counting and estimation, mid-level learners build on their understanding of the measures...
Virginia Department of Education
Box-and-Whisker Plots
The teacher demonstrates how to use a graphing calculator to create box-and-whisker plots and identify critical points. Small groups then create their own plots and analyze them and finish by comparing different sets of data using box...
Yummy Math
Should NFL Quarterbacks Shave or Grow a Beard?
What does facial hair have to do with quarterback ratings? Using a set of data that provides QBR with and without facial hair, football enthusiasts determine if performance is affected. It also has learners question if the relationship...
Illinois Valley Community College
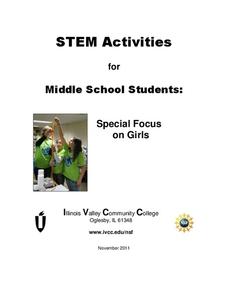
STEM Activities for Middle School Students
Use STEM activities within the class to provide connections to concepts. The resource includes activities that range from working with buoyancy to building rockets and launching them. Other activities involve the engineering design...
Statistics Education Web
How Wet is the Earth?
Water, water, everywhere? Each pupil first uses an Internet program to select 50 random points on Earth to determine the proportion of its surface covered with water. The class then combines data to determine a more accurate estimate.
Teach Engineering
Off-Road Wheelchair Challenge
Challenge your class to use their understanding of the engineering design process to design and build a small-scale, off-road prototype for an assistive technology device. Teams select materials to build their scale models, and, using...
Curated OER
Candy Bars
There is often more to data than meets the eye. Scholars learn that they need to analyze data before making conclusions as they look at data that describes the number of candy bars boys and girls eat. They disprove a given conclusion and...
Teach Engineering
Super Slinger Engineering Challenge
How well can you launch a ping-pong ball? Small groups design launchers that can launch a ping-pong ball 20 feet into a target. The teams follow the engineering design process as they develop a solution that meets the design...
Teach Engineering
Density Column Lab - Part 2
Groups suspend objects within layers of liquids to determine the densities of different liquids and compare them to the densities of objects calculated in Part 1. The groups then carefully test their calculations by layering the liquids...
Teach Engineering
Density Column Lab - Part 1
Mass and density — aren't they the same thing? This activity has groups use balance beams and water displacement to measure several objects. The pupils use the measurements to calculate the density of the objects.
Teach Engineering
Backyard Weather Station
Challenge young meteorologists to apply their knowledge of weather to build their own weather stations. The resource provides the directions to build a weather station that contains a wind vane, barometer, thermometer, and rain gauge....
Math Drills
Trick-Or-Treat Candy Probabilities
Class members satisfy their sweet tooth with a Halloween-themed, candy probability worksheet. Using images of candy pieces that represent data, young mathematicians find the probability of getting different pieces of candy while...
Willow Tree
Line Graphs
Some data just doesn't follow a straight path. Learners use line graphs to represent data that changes over time. They use the graphs to analyze the data and make conclusions.
Mathematics Assessment Project
Middle School Mathematics Test 4
Raise expectations in your classroom and assess learners through the provided performance tasks. Class members must apply concepts learned throughout the year, providing a good measurement of how well they understand the material. The...
Los Angeles County Office of Education
Assessment For The California Mathematics Standards Grade 6
Test your scholars' knowledge of a multitude of concepts with an assessment aligned to the California math standards. Using the exam, class members show what they know about the four operations, positive and negative numbers, statistics...
NASA
Lunar Colonization
A five-lesson unit challenges teams to design a complex to allow people to colonize the Moon. The teams first work in order to understand the challenge before becoming experts. Expert teams learn about different aspects needed to survive...
NASA
Creating a Space Exploration Infrastructure
What will it take to explore space? Teams of pupils determine the needs of a lunar outpost and research the required systems. The pupils then learn about the past space exploration vehicles. The third and final lesson challenges project...
Buffalo-Hanover Montrose Schools
Histogram Worksheet
Young mathematicians analyze a given set of numbers to complete a frequency table, and then make a histogram using the data. The worksheet includes three sets of data on the worksheet.
Shmoop
Box, Stem-Leaf, and Histogram
A helpful and versatile activity requires young mathematicians to analyze data in order to create graphs and answer questions. Additionally, it prompts learners to find the mean, median, mode, and range of some of the data sets.
K-5 Math Teaching Resources
Number Lines 0-20
Need a number line? Here are four number lines ranging from zero to twenty.
Laying the Foundation
Box-and-Whisker Plots
Statistics is made approachable, and dare we say fun, in this activity on using box-and-whisker plots to analyze and compare data sets. Specific emphasis is placed on interpretations and explanations while graphing, and in using the...


