Types of Graphs Teacher Resources
Find Types of Graphs lesson plans and worksheets
Showing 33,898 resources
Teach Engineering
Graphing Equations on the Cartesian Plane: Slope
Slopes are not just for skiing. Instructors introduce class members to the concept of slope and teach them how to calculate the slope from a graph or from points. The lesson also includes the discussion of slopes of parallel and...
Curated OER
Find Zeros of a Function Given the Graph
Introduce zeros of a function and their relationship to the graph of the function. an informative video uses the definition of a zero to help identify them on a graph and provides several examples of finding the zeros of a...
EngageNY
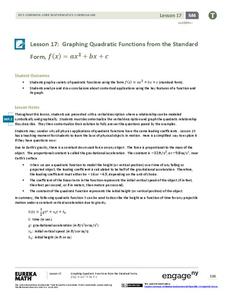
Graphing Quadratic Functions from the Standard Form
Use context to explain the importance of the key features of a graph. When context is introduced, the domain and range have meaning, which enhances understanding. Pupils use application questions to explore the key features of the graph...
EngageNY
Graphs of Simple Nonlinear Functions
Time to move on to nonlinear functions. Scholars create input/output tables and use these to graph simple nonlinear functions. They calculate rates of change to distinguish between linear and nonlinear functions.
National Education Association
Determine Minimum, Maximum, Vertex, and Zeros Given the Graph
Do not always be maxed out by the vertex. A short video introduces the graphical display of the vertex and zeros of a quadratic function. The presenter provides the definitions of the minimum and maximum of the graph along with...
Balanced Assessment
Toilet Graph
Mathematics can model just about anything—so why not simulate the height of water in a toilet bowl? The lesson asks pupils to create a graphical model to describe the relationship of the height of the water as it empties and fills again....
CK-12 Foundation
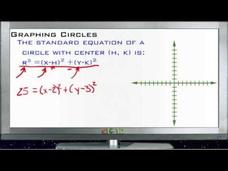
Graphing Circles: Lesson
Explore a standard method to graph a circle. Given the standard form of the equation of a circle, the segment of a basic geometry playlist shows how to graph the circle. The resource works examples of graphing a circle, finding the...
Illustrative Mathematics
Graphs of Power Functions
There are parent functions, and then there are parent functions with a really interesting way to explore them. High schoolers are asked to graph different combinations of parent functions together and determine the point of...
Willow Tree
Circle Graphs
Pie isn't just for eating! Scholars learn to create pie charts and circle graphs to represent data. Given raw data, learners determine the percent of the whole for each category and then figure out the degree of the circle that percent...
World Wildlife Fund
Graphs and Charts
A two-part learning exercise incorporating bar graphs and pie charts, young mathematicians can practice their graphing skills. Pupils answer questions using graphs and charts but are also challenged to create their own using a given set...
West Contra Costa Unified School District
Connecting Graphing and Solving Absolute Value Equations and Functions
Can you solve an equation graphically? Absolutely! This Algebra II lesson makes the connection between solving an absolute value equation and graphing two functions. Graphing absolute value functions is presented through the process of...
Krista King Math
Graphing Linear Equations
Uncover a process for graphing a linear equation in slope-intercept form with a video that describes how to determine the slope and y-intercept from the equation of a line. It then shows how to transfer those values to a graph...
Mathispower4u
Graphing by Finding Intercepts
There's more than one way to graph a line. A video presentation explores graphing linear equations by finding the intercepts. After explaining the concept of an intercept and how it relates to its coordinates, the presenter demonstrates...
Mathispower4u
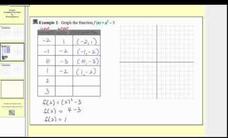
Graphing Functions by Plotting Points - Quadratic
Watch as your knowledge of quadratic functions grows parabolically. An educational video shows scholars how to graph quadratic functions. The method shown here is to create a table of values and graph the function by hand.
Mathispower4u
Graphing 9 Basic Functions
Graphing functions by hand is pretty easy. A comprehensive video reviews how to graph different function types. It looks at the constant, identity, quadratic, cubic, absolute value, square root, cube root, reciprocal, and squared...
Mathispower4u
Graph a Direct Variation Equation (Positive Slope) Example 1
Show classes a quick method to graphing. A short video demonstrates how to graph a direct variation equation by comparing it to graphing an equation in slope-intercept form. By seeing the y-intercept is 0, scholars easily plot the slope...
Illustrative Mathematics
Graphing Rational Functions
The slider feature on Desmos excellently shows how graphs change based on different variable values. Learners look at two similar rational functions and compare and discuss what happens when the numbers go from positive to zero to...
Concord Consortium
Graphing Elements
How do you graph a sentence? Scholars do just that as they represent relationships between independent and dependent variables with a graphical representation. Given a sentence, they determine the pertinent relationship and create a...
Mathispower4u
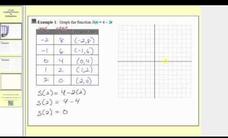
Graphing Functions by Plotting Points - Linear
It's a straight line to understanding how to graph linear functions. Scholars watch an informative video to learn the process of graphing linear functions. They understand how to make and fill in a table of values and then plot the...
Mathispower4u
Solving Systems of Linear Equations by Graphing - Part 2
Not all systems have a single solution. To begin the video, the narrator reviews the different number of solutions possible with a system of linear equations. He continues with examples of solving systems of equations by graphing. Unlike...
Urbana School District
Physics Intro, Kinematics, Graphing
Some consider physics the branch of science concerned with using long and complicated formulas to describe how a ball rolls. This presentation, while long, is not complicated, yet it covers rolling, falling, and more. It compares vectors...
Krista King Math
Graphing Parallel and Perpendicular Lines
What do parallel and perpendicular lines have to do with slope? The video highlights the importance of slope when graphing parallel and perpendicular lines. The instructor shows several examples of lines that are parallel and...
Mathispower4u
Graph a Linear Equation in General (Standard) Form
It's a straight line to understanding linear equations. Given a linear equation in standard form, scholars write the equation in slope-intercept form, identify the y-intercept, and use the slope to graph the line. An instructional video...
Curated OER
What's in a Graph?
Students explore how to use and interpret graphs. The graphs are pulled from a variety of sources, and the activities ask students to interpret graphs. They start this activity with knowledge of what a graph is. Students also know how to...
Other popular searches
- Tally Chart Graph
- Paper Pie Chart/graph
- Frog Chart Data Graph
- Heart Beats Graph Chart
- Chart and Graph Data
- Genetic Traits Chart Graph
- Graph and Chart Information
- Charts and Graph
- Gilded Age Chart Graph
- Chart Graph
- Line Graph T Chart
- Candy Heart Graph Chart


