EngageNY
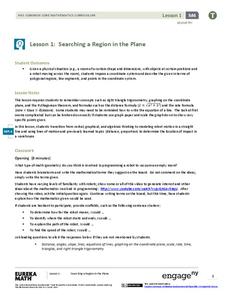
Searching a Region in the Plane
Programming a robot is a mathematical task! The activity asks learners to examine the process of programming a robot to vacuum a room. They use a coordinate plane to model the room, write equations to represent movement, determine the...
National Center for Injury Prevention and Control
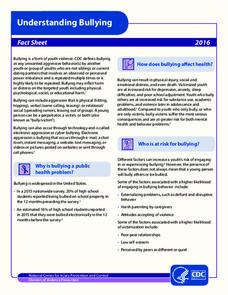
Understanding Bullying
The anti-bullying movement has become a focus across the country. Become an anti-bullying expert with a informative factsheet that details bullying, who is affected by it, and how to prevent it from happening at your school.
EngageNY
Modeling with Polynomials—An Introduction (part 1)
Maximizing resources is essential to productivity. Class members complete an activity to show how math can help in the process. Using a piece of construction paper, learners construct a box with the maximum volume. Ultimately, they...
EngageNY
Modeling with Exponential Functions
These aren't models made of clay. Young mathematicians model given population data using exponential functions. They consider different models and choose the best one.
EngageNY
Newton’s Law of Cooling, Revisited
Does Newton's Law of Cooling have anything to do with apples? Scholars apply Newton's Law of Cooling to solve problems in the 29th installment of a 35-part module. Now that they have knowledge of logarithms, they can determine the decay...
Noyce Foundation
Cereal
Find the best protein-packed cereal. The short assessment task covers equivalent and comparing ratios within a context. Pupils determine the cereal with the highest ratio of protein. A rubric helps teachers with point allotments for...
Noyce Foundation
Pizza Crusts
Enough stuffed crust to go around. Pupils calculate the area and perimeter of a variety of pizza shapes, including rectangular and circular. Individuals design rectangular pizzas with a given area to maximize the amount of crust and do...
Inside Mathematics
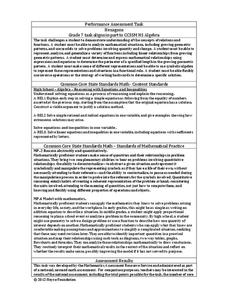
Hexagons
Scholars find a pattern from a geometric sequence and write the formula for extending it. The worksheet includes a table to complete plus four analysis questions. It concludes with instructional implications for the teacher.
Inside Mathematics
Snakes
Get a line on the snakes. The assessment task requires the class to determine the species of unknown snakes based upon collected data. Individuals analyze two scatter plots and determine the most likely species for five...
Inside Mathematics
Conference Tables
Pupils analyze a pattern of conference tables to determine the number of tables needed and the number of people that can be seated for a given size. Individuals develop general formulas for the two growing number patterns and...
Inside Mathematics
Quadratic (2009)
Functions require an input in order to get an output, which explains why the answer always has at least two parts. After only three multi-part questions, the teacher can analyze pupils' strengths and weaknesses when it comes to...
Inside Mathematics
Party
Thirty at the party won't cost any more than twenty-five. The assessment task provides a scenario for the cost of a party where the initial fee covers a given number of guests. The class determines the cost for specific numbers of guests...
Inside Mathematics
Picking Apples
Getting the best pick of the apples depends on where to pick. The short assessment presents a situation in which class members must analyze a real-world situation to determine the cost of picking apples. The pricing structures resemble...
Inside Mathematics
Vencent's Graphs
I like algebra, but graphing is where I draw the line! Worksheet includes three multiple-part questions on interpreting and drawing line graphs. It focuses on the abstract where neither axis has numbers written in, though both are...
EngageNY
Graphing Quadratic Functions from Factored Form
How do you graph a quadratic function efficiently? Explore graphing quadratic functions by writing in intercept form with a lesson that makes a strong connection to the symmetry of the graph and its key features before individuals write...
EngageNY
Modeling with Quadratic Functions (part 1)
Relevance is key! The resource applies quadratic modeling by incorporating application of physics and business. Pupils work through scenarios of projectile motion and revenue/profit relationships. By using the key features of the graph,...
Teaching Adapted PE
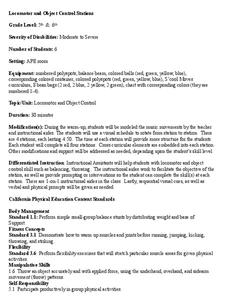
Locomotor and Object Control Stations
Develop children's basic locomotor and object control skills with an invigorating Adaptive PE instructional activity. A series of four, timed stations engaged the class in playing a game of Twister, walking on...
Inside Mathematics
Population
Population density, it is not all that it is plotted to be. Pupils analyze a scatter plot of population versus area for some of the states in the US. The class members respond to eight questions about the graph, specific points and...
Balanced Assessment
On Averages and Curves
Determine the average on a curve. The class finds graphical representations of averages and expresses them both symbolically and on the graph. The assessment requires class members to justify using average to describe graphs.
EngageNY
Representations of a Line
Explore how to graph lines from different pieces of information. Scholars learn to graph linear functions when given an equation, given two points that satisfy the function, and when given the initial value and rate of change. They solve...
EngageNY
Increasing and Decreasing Functions 1
Model situations with graphs. In the fourth installment of a 16-part module, scholars learn to qualitatively analyze graphs of piecewise linear functions in context. They learn to sketch graphs for different situations.
EngageNY
Increasing and Decreasing Functions 2
Explore linear and nonlinear models to help your class build their function skills. In a continuation of the previous lesson, learners continue to analyze and sketch functions that model real-world situations. They progress from linear...
Georgian Court University
Introduction to Marsh Ecology
Compare and contrast the characteristics of fresh and salt water marshes. After exploring the typical plants and animals found in each marsh type, participants use a set of flash cards to sort into fresh and salt water marsh life. Their...
Virginia Department of Education
Functions 2
Demonstrate linear and quadratic functions through contextual modeling. Young mathematicians explore both types of functions by analyzing their key features. They then relate these key features to the contextual relationship the function...
Other popular searches
- Verbal Communication
- Non Verbal Communication
- Examples of Verbal Irony
- Non Verbal Communication
- Algebra 2 Verbal Equations
- Verbal Communication Skills
- Verbal Irony
- Non Verbal Language
- Verbal Irony Cartoons
- Verbal Expressions
- Verbal Demonstration
- None Verbal Communication


