CK-12 Foundation
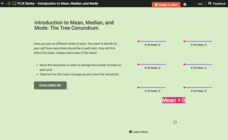
Introduction to Mean, Median, and Mode: The Tree Conundrum
How many trees should we plant? Using an interactive as a manipulative, individuals find the mean, median, and mode for sets of data. They determine the number of trees to plant in each plot of land to reach a statistical goal.
Howard Hughes Medical Institute
Lesson 3: Scientific Inquiry with WildCam Gorongosa
When biologists installed cameras in Gorongosa National Park, they ended up viewing a lot more than the lions they were trying to help! Young ecologists observe one of Africa's most beautiful savanna regions with interactive trail camera...
University of North Carolina
Statistics
Let's see you back it up! As shown in the 18th handout in the Writing the Paper series of 24 lessons from UNC, statistics help form an effective argument. The handout discusses how to analyze a source and break down the data to ensure it...
Social Media Toolbox
Social Media Plan
It's gameplan time! Journalism scholars create a social media plan based upon work completed in previous lessons. The activity, fifth in a 16-part Social Media Toolbox series, focuses on using data and consensus to create an effective...
Serendip
Photosynthesis and Cellular Respiration
How does energy from the sun make plants grow? Scholars move step by step through the processes that promote plant propagation during a detailed lesson. The resource illustrates ADP production and hydrolysis, then allows learners to...
101 Questions
Pokémon Go Cheat
Gotta catch them all—no learner left behind! Young scholars must predict the length of time it takes a phone attached to a fan to travel five kilometers given the radius and rotations versus time data. Why would you attach a phone to a...
Mascil Project
Epidemics: Modelling with Mathematics
The Black Death epidemic is responsible for more than one million deaths in the United Kingdom. An inquiry-based activity has young scholars explore the rate of disease spread. They then analyze graphs showing data from epidemics such as...
Council for Economic Education
The Neolithic Agricultural Revolution
What effect could one person's invention have on the human race? In the case of the Neolithic Agricultural Revolution, small improvements in farming methods led to increased food production. The human population began to boom, leading us...
Didax
Pi Day #1a – Discovering Pi
Unravel the mystery behind the infamous number pi. Scholars complete a series of activities that explores where pi comes from, its digits and estimation strategies. Pupils should be ready to measure, calculate, and look for patterns to...
Science Matters
Photosynthesis-Cellular Respiration Cycle
The balance of nature can be a wondrous thing! With the 19th activity of the 21-part series on systems, learners explore the cycle of photosynthesis and cellular respiration using a lab-based activity. Groups set up different test tubes...
Newspaper Association of America
By the Numbers: Mathematical Connections in Newspapers for Middle-Grade Students
A cross-curricular resource teaches and reinforces mathematical concepts with several activities that use parts of a newspaper. Scholars use scavenger hunts to find the different ways math is used in the paper along with using data...
Constitutional Rights Foundation
Automation and the American Worker
A thought-provoking resource examines the future of automation and the effects on employment. Academics read informational text, complete written prompts, and participate in activities to understand automation and the possibilities for...
Curated OER
Baseball Relationships - Using Scatter Plots
Students use graphing calculators to create scatter plots of given baseball data. They also determine percentages and ratios, slope, y-intercepts, etc. all using baseball data and statistics.
Curated OER
The Appearance of a Graph
Sixth graders understand that the appearance and increment used on the x and y axis in a graph change how it looks. In this graphing activity, 6th graders work in pairs and interpret graphs using different axes. Students collect graphs...
Curated OER
Scatter Plots
Seventh graders investigate how to make and set up a scatter plot. In this statistics lesson, 7th graders collect data and plot it. They analyze their data and discuss their results.
Curated OER
Environmental Issues in Multimedia Presentation
Learners investigate a community environmental issue. They document it using traditional scientific methods, digital photography, and videotaping. After collecting data, they graph the results. Students present their findings in a...
Curated OER
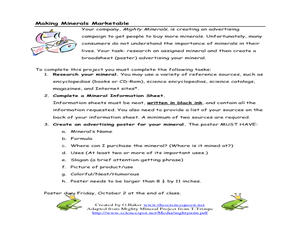
Making Minerals Marketable Data Sheet
In this minerals activity, middle schoolers investigate a mineral by doing research, they complete a mineral information sheet and they develop an advertising poster for the mineral.
Curated OER
Interpreting Data and Statistics
Students define random sample and complete surveys. In this algebra lesson plan, students create surveys and define the way people analyze these results. They discuss random sample as it relates to the Great Depression and come up with...
Cornell University
Fibers, Dyes, and the Environment
Nanofibers can be made through electrospinning or force spinning in order to reduce the negative impact on the environment. Pupils study the role of fibers and dye on the environment through a series of five hands-on activities. Then,...
Curated OER
The Chesapeake Bay in Captain John Smith's Time
When Captain John Smith visited the Chesapeake Bay in the summer of 1608, what types of animals and habitats did he encounter? Your young historians will analyze primary source documents to answer this question, as well as compare the...
Curated OER
Understanding Digestion
Learners analyze data from their primary literature (textbook) and explore multiple
aspects of digestion by generating alternative or multiple explanations for questions posed during the activity. This activity includes a handout with...
Curated OER
Understanding Equations of Functions
Students write equations for different functions. In this algebra lesson, students observe data and find the function that goes along with that data. The identify the line of best fit.
Curated OER
Introduction to Graphs: Bar Graphs, Line Graphs, Circle Graphs
In this graphing data worksheet, learners answer 5 short answer questions about graphs. Students determine which type of graph best represents various data sets.


