Curated OER
Dividing
When dividing by 10 there are a few tricks scholars can use to make their lives a lot easier. Show them the examples to see if they notice a trend before assigning this three-part set of exercises. The first 18 are horizontal division...
Mathematics Vision Project
Modeling Data
Is there a better way to display data to analyze it? Pupils represent data in a variety of ways using number lines, coordinate graphs, and tables. They determine that certain displays work with different types of data and use two-way...
CK-12 Foundation
Line Graphs to Display Data Over Time: Strawberry Competition
Take the tediousness out of graphing. Using the interactive tool, learners can efficiently create a line graph from a set of data. They then use the graph to answer questions about specific trends in the data.
PBS
Real-World Proportional Relationships: Gender Wage Gap
When will the gender wage gap disappear? Scholars use a provided infographic to see trends in wage gap over time. They use ratios of women's wages to men's wages to determine which decades had the greatest change in the wage gap. The...
Howard Hughes Medical Institute
Coral Reefs in Hot Water
Global warming is leaving coral reefs in hot water. What does that mean for their survival? Find out as scholars use authentic satellite data to explore the issue. Learners look for global trends in the data and research the effects the...
CCSS Math Activities
Smarter Balanced Sample Items: 7th Grade Math – Target H
Not one but two box plots. How will your pupils fare? Assess their understanding of box plots by having them compare two populations. The eighth of nine installments in the Gr. 7 Claim 1 Item Slide Shows series, the resource has them...
Curated OER
Trends of Snow Cover and Temperature in Alaska
Students compare NASA satellite data observations with student surface measurements of snow cover and temperature. They practice data collection, data correlations, and making scientific predictions.
Curated OER
Chapter 7 Word Search
In this statistics worksheet, students locate and identify various vocabulary terms related to mathematics and statistics. There are seven words located in the puzzle to find.
Curated OER
Horizontal Bar Graph: Changes in Nebraska Population
In this bar graph worksheet, students learn about the changes in Nebraska's population from 1880 to 2000 by studying a bar graph. Students answer 7 questions about the graph.
Willow Tree
Approximating a Line of Best Fit
You may be able to see patterns visually, but mathematics quantifies them. Here learners find correlation in scatterplots and write equations to represent that relationship. They fit a line to the data, find two points on the line, and...
EngageNY
Scatter Plots
Scholars learn to create scatter plots and investigate any relationships that exists between the variables with a lesson that also show them that statistical relationships do not necessarily indicate a cause-and-effect relationship.
EngageNY
Patterns in Scatter Plots
Class members investigate relationships between two variables in the seventh installment of a 16-part module that teaches scholars how to find and describe patterns in scatter plots. Young mathematicians consider linear/nonlinear...
Curated OER
Precipitation in Michigan Cities
Third graders investigate the rainfall amounts in four Michigan cities to observe how cities near lakes are affected differently by precipitation than those that are inland. They record the rainfall for the cities over an eight day...
CCSS Math Activities
Scatter Diagram
Don't let a great resource scatter to the winds. Pupils analyze two sets of test scores on a scatter plot. They draw a line of best fit and use it to make predictions about the test scores. They also consider any apparent trends in the...
Howard Hughes Medical Institute
Population Dynamics
Will human population growth always be exponential, or will we find a limiting factor we can't avoid? Young scientists learn about both exponential and logistic growth models in various animal populations. They use case studies to...
Curated OER
It's the Law: Periodically
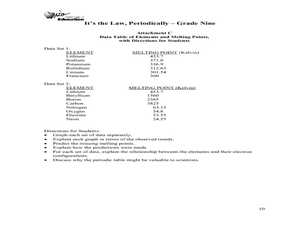
Ninth graders examine the Periodic Table. In this element lesson, 9th graders observe the chemical reactivity of elements. They graph the properties and discuss the trend in the group and period of elements. The students use math to...
Curated OER
You Bet!
Students explore the mathematical probabilities involved in gambling and how these factors affect people's behavior. They work in pairs and conduct and experiment pertaining to blackjack. The class creates a graph showing the trends found.
Curated OER
Polar Bear Panic!
Students identify the three realms of the Arctic Ocean, and describe the relationships between these realms. They graphically analyze data on sea ice cover in the Arctic Ocean, and recognize a trend in these data.
Curated OER
A Picture's Worth a Thousand Words
Young scholars analyze the numbers of male vs female administrators and teachers from their school. In this gender equality lesson plan, students use school yearbooks from the 1950's threw present to count how many male vs. female...
Curated OER
Tracking Fall's Falling Temperatures
Young meteorologists track weather from day to day and record results on graphs, maps, or other places. They see firsthand how weather temperatures trend cooler as fall progresses and practice grade-appropriate skills in geography (map...
Curated OER
Graphs
In this graphs worksheet, learners solve and complete 9 various types of problems. First, they use a large scatter graph to complete a described trend in data. Then, students find the difference of negative numbers and place them in...
Curated OER
What is a Family?
Students explore how Canadian families have evolved over time. In this census results lesson, students examine the factors that contribute to changing family and household structures. Students also create written and illustrated profiles...
Curated OER
Cinco De Mayo
High schoolers make a graph identifying the immigration of Mexicans to the US. In this algebra lesson, students practice graphing as they review different trends in immigration over the past 100 years. They interpret and analyze their...
Curated OER
Population Pyramids
High schoolers engage in a lesson that is about the concept of measuring the statistical data of a population taken from a census. The data is interpreted and recorded looking for trends in subjects like world economy and job opportunities.
Other popular searches
- Periodic Table Trends
- Periodic Trends
- Fashion Trends
- Employment Trends
- Cultural Trends
- The Periodic Table Trends
- Health Trends
- Popular Trends
- Food Trends in the Uk
- Economic Trends
- Long Term Trends
- Population Trends


