Curated OER
Reading Comprehension 1: Level 11
Here’s a reading comprehension assessment that will capture the interest of your learners. Stink bugs and the danger they pose to farmers is the subject of the passage, while the eight questions ask readers to infer, predict, summarize...
Curated OER
Toothpick Patterns
In this patterning worksheet, students identify and complete 15 different patterns that include using toothpicks. First, they determine the number of toothpicks needed to create each figure in a given sequence. Then, students determine...
MENSA Education & Research Foundation
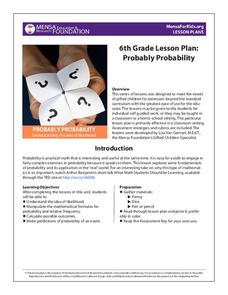
Probably Probability
Reinforce the concept of probability with a series of lessons highlighting the idea of likelihood, probability formulas, relative frequency, outcomes, and event predictions. The collection is made up of four lessons offering informative...
Raytheon
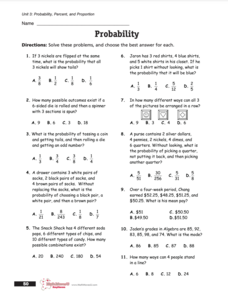
Probability, Percent, and Proportion
In this probability and predictions learning exercise, students read 1 page of facts, then solve 8 pages of problems related to probability, with answers keys included.
Curated OER
Using Extrapolations
For this using extrapolations worksheet, 6th graders use data analysis to answer nine questions about data prediction and extrapolation.
Teacher's Corner
Hey Batter, Wake Up!
Does jet lag affect a baseball team's performance in games? Read about how a baseball team's chance of winning a game can be affected by traveling over one, two, and three time zones. Readers then respond to five short answer questions...
Curated OER
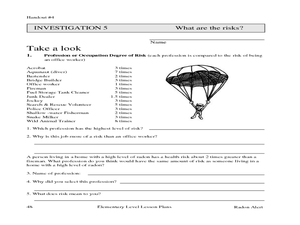
Radon Alert: Understanding Odds
In this radon alert: understanding odds worksheet, 5th graders predict results of rolling dice and record data in a chart, then compare odds of events and occupations, then compare that with radon exposure.
Curated OER
Using Random Sampling to Draw Inferences
Emerging statisticians develop the ability to make inferences from sample data while also working on proportional relationships in general. Here, young learners examine samples for bias, and then use random samples to make inferences...
California Education Partners
Summer Olympics
Quickly get to the decimal point. The last assessment in a nine-part series requires scholars to work with decimals. Pupils compare the race times of several athletes and calculate how much they have improved over time. During the second...
Illustrative Mathematics
Walk-a-thon 2
During a walk-a-thon your learners must determine the walking rate of Julianna's progress. Using tables, graphs, and an equation, they must be able to calculate the time it took her to walk one mile and predict her distance based on the...
Inside Mathematics
Scatter Diagram
It is positive that how one performs on the first test relates to their performance on the second test. The three-question assessment has class members read and analyze a scatter plot of test scores. They must determine whether...
Illustrative Mathematics
Walk-a-thon 1
Your mathematician's job is to explore the relationship between hours and miles walked during a walk-a-thon. The activity compels your learners to experiment with different means in finding out this proportional relationship. The answer...
National Council of Teachers of Mathematics
Cash or Gas?
Which option provides the best payout? Pupils predict which lottery prize to take. They devise a method to calculate which prize would likely provide the greatest monetary value.
EngageNY
Comparing Estimated Probabilities to Probabilities Predicted by a Model
Small groups devise a plan to find the bag that contains the larger percentage of blue chips. they then institute their plans and compare results to the actual quantities in the bags.
California Education Partners
Science Fair Project
Plant the data firmly on the graph. Given information about the growth rate of plants, pupils determine the heights at specific times and graph the data. Using the information, scholars determine whether a statement is true and support...
Mathed Up!
Stratified Sampling
Young mathematicians learn how to solve problems involving stratified sampling. They review concepts of sampling and proportionality by watching a video and then they complete a activity of questions on this topic.
Curated OER
Cost analysis
In this Algebra I worksheet, 9th graders analyze a problem in which basic assumptions must be made about cost and demand for the product or item. Students use a graph to make predictions and determine the best price at which to sell an...
Curated OER
Walking the Plank
This is a cool math activity. Kids collect and interpret data based on a physical act. A board is balanced between a scale and a step, learners record a peer's weight as it decreases while s/he walks further away from the scale. They...
Texas Woman’s University
Patterns, Patterns Everywhere!
Not only is pattern recognition an essential skill for young children to develop, it's also a lot of fun to teach! Over the course of this lesson, class members participate in shared readings, perform small group activities, and complete...
Curated OER
Designing a Speedometer
In this algebra worksheet, students analyze the designs of a speedometer. They collect data on the distance and time as the speedometer works. They draw conclusion and make predictions from the collected data. There are 4 word problems.
Virginia Department of Education
Growing Patterns and Sequences
Learners explore, discover, compare, and contrast arithmetic and geometric sequences in this collaborative, hands-on activity. They build and analyze growing patterns to distinguish which kind of sequence is represented by a set of data...
Curated OER
Palindromes
In this math worksheet, students solve 56 multiplication problems. Students read about palindromes and discover patterns in multiplying by 11's and multiplying 8-digit numbers.
Curated OER
High School Mathematics Problems from Alaska: Reading a Graph: Azimuth Range vs. Day in Barrow, Alaska
Students focus on reading and interpreting information from a graph.
Curated OER
The Geometry of Real Images
For this math worksheet, students read the examples for using the techniques of mathematical modeling. They draw the angles in order to simulate the reflection of light while using a concave mirror.
Other popular searches
- Making Predictions Reading
- Predictions in Reading
- Making Predictions in Reading
- Reading Prediction Strategy
- Predictions Before Reading
- Reading Prediction Outcome
- Reading Prediction Skills
- Making Prediction in Reading
- Guided Reading Predictions
- Predictions Reading
- Prediction in Reading
- Prediction Reading


