Illustrative Mathematics
Sounds Really Good! (Sort Of...)
Winning a lottery game with 60% odds sounds like a no brainer. This is when the math kicks in to show players that in the long run, they lose money the more often they play. Here is one simple question that opens the doors to a nice...
College Board
2015 AP® Statistics Free-Response Questions
Statistics is all about making inferences. Can you infer how your pupils will fair on their AP® exams? Collect your own data by giving them practice tests such as the 2015 free-response exam. The six-question test includes topics such as...
Curated OER
Poisson Distribution Worksheet
In this Poisson Distribution worksheet, students compute the discrete probability for the occurrence of events under the given situation or interval. This four-page worksheet contains approximately 20 problems. This worksheet may be...
Curated OER
Frequency Distributions and Measures of Central Tendency
Twelfth graders use the Internet to research information on NFL players and construct frequency distributions from the data. They calculate the mean, medium and analyze their data.
Curated OER
Z-Scores related to Psychology
In this z-score learning exercise, students identify the z-scores and percentiles corresponding to thirteen values. Students are also asked to find two probabilities. Worked solutions are provided after each question.
Curated OER
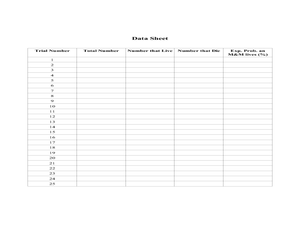
RIP M&M's
Students solve theoretical probability problems. For this algebra lesson, students apply the concept of probabilities to solving real life scenarios. They collect data and graph it using experimental probability.
Curated OER
Chapter 5 Review
In this statistics worksheet, students solve and complete 10 different types of problems. First, they determine the probability of various actions described. Then, students describe an appropriate model for the number described and...
Curated OER
Shake It Up with Scatterplots
Students identify how to use a scatterplot to compare two sets of data to determine if they are related. Then they identify and describe the definition of regression line (the "line of best fit"). Students also identify how scientists...
Curated OER
New York State Testing Program: Mathematics Test Book 2
In this mathematics test book, learners answer problems dealing with topics covered during the year. They solve problems dealing with percent, probability, properties, and interpreting graphs. This sixteen page worksheet contains...
Statistics Education Web
The Egg Roulette Game
Hard boiled or raw? Which egg will you get? A hands-on activity has scholars explore the impact of conditional probability. Based on a skit from the Tonight Show, pupils model the selection of the two types of eggs using beads. They...
College Board
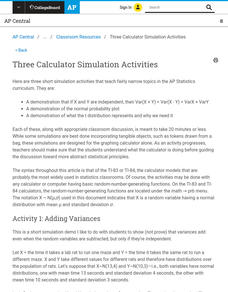
Three Calculator Simulation Activities
Calculators sure come in handy. An AP® Statistics instructional resource provides suggestions for using calculator simulations. It gives activities for adding variances, normal probability plots, and t distributions.
Rice University
Introductory Statistics
Statistically speaking, the content covers several grades. Featuring all of the statistics typically covered in a college-level Statistics course, the expansive content spans from sixth grade on up to high school. Material comes from a...
Virginia Department of Education
Organizing Topic: Data Analysis
Learners engage in six activities to lead them through the process of conducting a thorough analysis of data. Pupils work with calculating standard deviations and z-scores, finding the area under a normal curve, and sampling techniques....
Curated OER
Word Problem Practice Workbook
Need worksheets that challenge your middle schoolers to apply their understanding of math? Problem solved! From integers, fractions, and percents, to algebra, geometry, and probability, over 100 pages of word problem worksheets are...
Shodor Education Foundation
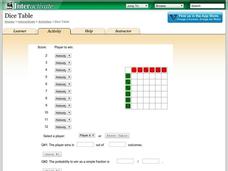
Dice Table
Convert a table to probabilities. Pupils set up the winning rules for the sums of two dice. Using the rules, the applet fills out a table showing the winners for each combination. Learners determine the probabilities of winning for each...
EngageNY
Sampling Variability in the Sample Proportion (part 1)
Increase your sample and increase your accuracy! Scholars complete an activity that compares sample size to variability in results. Learners realize that the greater the sample size, the smaller the range in the distribution of sample...
Curated OER
Observing M&M Colors: A Multinomial Experiment
Learners use hands-on activities to study statistics. They review the chi-square distribution and expected value. Activities involve discovering calculation a hypothesis, frequency distribution, and probability.
Curated OER
Ingetrated Algebra Practice
For this integrated algebra worksheet, students solve probability problems. They identify the appropriate sample space for the given experiment. This two-page worksheet contains 4 multiple-choice problems. Answers are provided on the...
Curated OER
Sampling Distribution and Estimators Section 6.4
In this distribution worksheet, students examine given situations, determine the probability of an event, identify the standard deviation, and find a specified percentile and quartiles. Five probability story problems are available on...
CK-12 Foundation
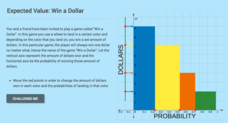
Expected Value: Win a Dollar
Spin a wheel, land on a color ... and win. Learners create a graph to display the probabilities of the amount of money they can win by spinning a colored wheel. The pupils use the dollar amounts and their probabilities to calculate the...
Beyond Benign
Can You Hear Me Now? Cell Phone Accounts
How sustainable are cell phones? Throughout the unit, learners explore the issues around cell phones concerning sustainability. Class members take a graphical look at the number of cell phones across the world using a box-and-whisker...
College Board
2010 AP® Statistics Free-Response Questions Form B
Form a good familiarity with the AP® test using Form B of the 2010 AP® Statistics free-response questions. Pupils use a test from a previous administration to prepare for their exams. A set of six questions assesses box plots,...
Radford University
How Normal Are You?
It's completely normal to learn about normal distributions. An engaging lesson has young statisticians collect and analyze data about their classmates as well as players on the school's football team. They determine whether each set of...
Curated OER
Mathematics: A Picture's Worth a Thousand Words
Students examine school yearbooks from 1950 to the present. They count the number of male and female teachers and administrators. They compile date and extrapolate changes in job trends.


