EngageNY
Determining Discrete Probability Distributions 1
Learn how to determine a probability distribution. In the ninth installment of a 21-part module, future mathematicians use theoretical probabilities to develop probability distributions for a random variable. They then use these...
Curated OER
Binomial Probability Distribution Section 5.4
In this Binomial Probability Distribution, students use the binomial probability formula to determine the success of a given probability. Using the given parameters, students write a probability equation and solve the problem. They...
EngageNY
Determining Discrete Probability Distributions 2
Investigate how long-run outcomes approach the calculated probability distribution. The 10th installment of a 21-part module continues work on probability distributions from the previous lesson. They pool class data to see how conducting...
EngageNY
Probability Distribution of a Discrete Random Variable
Learn how to analyze probability distributions. The sixth installment of a 21-part module teaches pupils to use probability distributions to determine the long-run behavior of a discrete random variable. They create graphs of probability...
EngageNY
Estimating Probability Distributions Empirically 1
What if you don't have theoretical probabilities with which to create probability distributions? The 11th installment of a 21-part module has scholars collecting data through a survey. The results of the survey provide empirical data to...
EngageNY
Estimating Probability Distributions Empirically 2
Develop probability distributions from simulations. Young mathematicians use simulations to collect data. They use the data to draw graphs of probability distributions for the random variable in question.
Curated OER
Continuous Probability Distributions
In this continuous probability distribution worksheet, students identify discrete and continuous distributions. They calculate the linear combination of the independent normal random variable and determine probabilities using exponential...
Statistics Education Web
Odd or Even? The Addition and Complement Principles of Probability
Odd or even—fifty-fifty chance? Pupils first conduct an experiment rolling a pair of dice to generate data in a probability lesson. It goes on to introduce mutually exclusive and non-mutually exclusive events, and how to use the Addition...
CK-12 Foundation
Expected Value: Creating a Discrete Probability Distribution Table
Wanna roll the dice? Determine whether it is a good idea to play a dice game. An interactive presents the rules for a game of dice. Pupils find the probabilities of each event and calculate the expected value of the game. They finish...
Curated OER
Random Probability
In this statistics and probability worksheet, young statisticians solve and complete 13 different problems related to probability, percentages, and normal distributions. They consider data models, assumptions about the models, and find...
Curated OER
4 Discrete Probability Distributions
High schoolers read and complete problems on how to solve discrete probability distributions. In this probability distributions lesson plan, students read math problem examples and solve them.
Virginia Department of Education
Normal Distributions
Pupils work to find probabilities by using areas under the normal curve. Groups work to calculate z-scores and solve real-world problems using the empirical rule or tables.
EngageNY
Using a Curve to Model a Data Distribution
Show scholars the importance of recognizing a normal curve within a set of data. Learners analyze normal curves and calculate mean and standard deviation.
Statistics Education Web
What Does the Normal Distribution Sound Like?
Groups collect data describing the number of times a bag of microwave popcorn pops at given intervals. Participants discover that the data fits a normal curve and answer questions based on the distribution of this data.
Curated OER
Finding Probability Using the Normal Probability Distribution
In this normal distribution worksheet, students find probability in four problems using the normal probability distributions. Students should sketch the curve and shade the region.
CK-12 Foundation
Normal Approximation of the Binomials Distribution: When to Approximate
Normalizing a binomial distribution — determine when it is all right. Given the rule of thumb of when it is appropriate to use the normal distribution to approximate a binomial distribution, pupils look at different scenarios. Scholars...
CK-12 Foundation
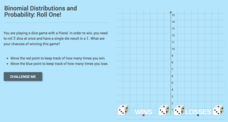
Binomial Distributions and Probability: Roll One!
It takes exactly one to win. Pupils calculate the probability of rolling five dice and having only a single die come up with a one. Learners calculate the number of expected wins out of a series of games. The interactive provides...
Curated OER
Probability and Applications of Simulations
Middle schoolers apply properties of probability to the real world. In this probability lesson, learners simulate the construction of empirical distribution. They collect and analyze data using central tendencies.
PHET
Plinko Probability
It's a good thing the resource dropped into your radar. Young mathematicians use an app that randomly drops balls through a Plinko game and into bins. They compare the distribution to that of an ideal binomial distribution.
Curated OER
Range, Cluster, Gap and Outliers
There are a number of activities here where learners collect and record data, as well as, activities where the likelihood of an event happening is calculated given the experimental probability. Young statisticians organize information...
Curated OER
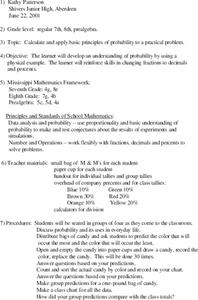
Probability using M & M's
Using M & M's candies, young statisticians predict the color distribution in a packet of candies and test their predictions against their group and the larger class. A review of converting between fractions, decimals, and percents...
Curated OER
M&M Probability
Students apply the scientific method in order to determine the probability of specific colors in a bag of M&M's. They determine the definition of probability and how it can be used. They make a hypothesis and conduct an experiment to...
Illustrative Mathematics
Fred's Fun Factory
Spin to win! Individuals calculate the average number of tickets expected based on a probability distribution for the number of tickets per spin. Pupils use that information to determine the average number of tickets that can be won...
Curated OER
Probability Distributions
Students collect and plot data on a graph. In this statistics lesson, students analyze the distribution of a sample and predict the outcome. They find the line of best fit and discuss what would make the sample larger.


