Code.org
Check Your Assumptions
Always check your assumptions when interpreting data and data visualizations. That's the take away from this exercise. Class members examine a failed project that looks at search trends to predict flu outbreaks and consider the...
Howard Hughes Medical Institute
Human Impacts on Biodiversity
Have you always wanted to take your science class on an amazing field trip they will never forget? Now you can! Observe the wildlife in an African savanna through trail cameras with a five-part data analysis activity. Learners analyze...
Workforce Solutions
Miniature Gulf Coast Project
Scholars show what they know about data collection and analysis with an activity that examines a smaller population of Houghton, Texas. Independently or in pairs, learners identify their research question, gather, graph, and analyze...
EngageNY
Posing Statistical Questions
Is this a statistical question? The opening lesson in a series of 22 introduces the concept of statistical questions. Class members discuss different questions and determine whether they are statistical or not, then they sort the data...
Howard Hughes Medical Institute
Measuring Biodiversity in Gorongosa
Take your biology class' understanding of biodiversity to a whole new level! Ecology scholars use data to calculate three different diversity indices based on the organisms in the Gorongosa National Park. The four-part activity uses an...
American Statistical Association
Scatter It! (Predict Billy’s Height)
How do doctors predict a child's future height? Scholars use one case study to determine the height of a child two years into the future. They graph the given data, determine the line of best fit, and use that to estimate the height in...
Kenan Fellows
Least Squares Linear Regression in R
The task? Determine the how effective hospitals are at reducing the rate of hospital-acquired infections. The method? Data analysis! Using an open source software program, individuals use provided data and create scatterplots to look for...
EngageNY
Linear and Exponential Models—Comparing Growth Rates
Does a linear or exponential model fit the data better? Guide your class through an exploration to answer this question. Pupils create an exponential and linear model for a data set and draw conclusions, based on predictions and the...
Howard Hughes Medical Institute
Got Lactase? Blood Glucose Data Analysis
Many physicals include a blood glucose test, but what are doctors actually testing? Scholars graph and interpret blood glucose data, allowing them to observe the differences in lactase persistence and draw conclusions. They then connect...
Curated OER
Analysis of Data
Learners analyze DNA banding patterns for similarities and differences among individuals and between populations. They examine individual prepared gels then pool the class data to come to an overall conclusion.
Curated OER
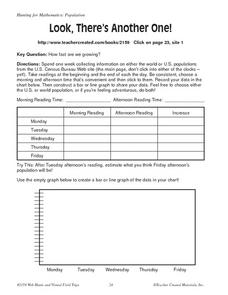
Look, There's Another One!
In this math worksheet, young scholars spend a week collecting information on either the word or U.S. populations from the U.S. Census Bureau Web site. Students record their data in a chart and bar graph. Young scholars also use the...
EngageNY
Modeling an Invasive Species Population
Context makes everything better! Groups use real data to create models and make predictions. Classmates compare an exponential model to a linear model, then consider the real-life implications.
Curated OER
What's in a Graph?
How many yellow Skittles® come in a fun-size package? Use candy color data to construct a bar graph and a pie chart. Pupils analyze bar graphs of real-life data on the Texas and Massachusetts populations. As an assessment at the end of...
LABScI
Population Dynamics: The Predator-Prey Lab
Wolves eat better when the bunny population increases, but how long does that last? A series of 12 biology lessons uses the sixth installment to explore the predator-prey relationship between bunny and wolf populations. Young scientists...
CK-12 Foundation
Interpretation of Circle Graphs: Northwest Region Population Pie
Given populations of the five Northwestern states, learners create a circle graph. Using the data and the pie chart, they make comparisons between the populations of the states. Finally, the pupils determine how the chart will change...
Curated OER
Where Should We Put a Store?
Students analyze population data. They convert population data into simple density maps to help make decisions about their world. They select the best location for a school store based on population density. They present their maps...
Curated OER
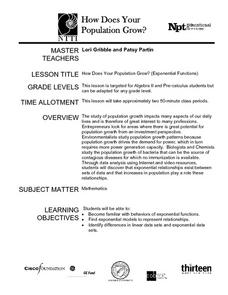
How Does Your Population Grown?
Do you know how the population has grown of your community? Can you predict the population over the next half century? Can we find an algebraic model that matches our data? These along with many more questions can be researched by...
Curated OER
What's Your Average? What Do You Mean? I'm More Than Just Average
Upper grade and middle schoolers collect data, analyze and interpret the data. This three-part lesson should provide learners with a firm understanding about the differences between mean, median, and mode and how to perform the...
Curated OER
Statistics and Shopping
Explore how statistics are used in everyday life. Your soon-to-be savvy consumers use the Internet to find consumer-related statistical information and learn to make wise consumer decisions. Includes links to a practice sheet about data...
Curated OER
Play It
There are a number of activities here that look at representing data in different ways. One activity, has young data analysts conduct a class survey regarding a new radio station, summarize a data set, and use central tendencies to...
Curated OER
Why Are The Shore Birds Dying?
Students engage in a field study of birds and how they are in danger harm due to environmental factors. They list different possible causes in a prediction activity. The observations are done while writing up data and connecting it to a...
Curated OER
World Population Activity II: Excel
Learners import UNEP World population data/projections from either the World Population Prospects: The 2002 Revision Population Database - UN Population Division or a text file. They graph this data by itself, and then along with...
Annenberg Foundation
Skeeters Are Overrunning the World
Skeeters are used to model linear and exponential population growth in a wonderfully organized lesson plan including teachers' and students' notes, an assignment, graphs, tables, and equations. Filled with constant deep-reaching...
Federal Reserve Bank
FRED in the Classroom: Employment and the Labor Force
Acquaint your class members with data sources for employment in the United States and help them gain a better understanding of a vital measure of our economy's health.
Other popular searches
- Graphing Population Data
- Population Data Collection
- Us Population Data
- U.s. Population Data
- Population Data Lesson


