Curated OER
Human Population- Changes in Survival Rates Data Interpretation
In this human population changes in survival worksheet, students interpret and plot data to understand the differences in human mortality and survivorship between historic and modern times. They investigate how these changes influence...
Inside Mathematics
Population
Population density, it is not all that it is plotted to be. Pupils analyze a scatter plot of population versus area for some of the states in the US. The class members respond to eight questions about the graph, specific points and...
Georgia Department of Education
Math Class
Young analysts use real (provided) data from a class's test scores to practice using statistical tools. Not only do learners calculate measures of center and spread (including mean, median, deviation, and IQ range), but also use this...
Concord Consortium
People and Places
Graph growth in the US. Given population and area data for the United States for a period of 200 years, class members create graphs to interpret the growth over time. Graphs include population, area, population density, and population...
Curated OER
Focus on Economic Data: US Employment and the Unemployment Rate, March, 2012
Read all about the various types of unemployment and the United States is are currently at the low-point of an unemployment cycle. Kids examine what economic factors affect the unemployment rate, and what data shows for different US...
Beyond Benign
Municipal Waste Generation
Statistically, waste may become a problem in the future if people do not take action. Using their knowledge of statistics and data representation, pupils take a look at the idea of waste generation. The four-part unit has class members...
Curated OER
Graph It!
There is more than one way to represent data! Learners explore ways to represent data. They examine stacked graphs, histograms, and line plots. They conduct surveys and use stacked graphs, histograms, or line plots to chart the data they...
Curated OER
Historical Population Changes in the US
Students conduct research on historical population changes in the U.S. They conduct Internet research on the Historical Census Data Browser, create a bar graph and data table using a spreadsheet program, and display and interpret their...
Education World
The African American Population in US History
How has the African American population changed over the years? Learners use charts, statistical data, and maps to see how populations in African American communities have changed since the 1860s. Activity modifications are included to...
Curated OER
Smoking Today = Smoking Tomorrow
Examine statistical data to recognize the relationship of statistics to real-world issues. Pupils navigate e-stat using the Internet and find data about social issues. They complete a worksheet with their data and create an anti-smoking...
Curated OER
US Population 1982-1988
Your algebra learners make predictions using the concepts of a linear model from real-life data given in table form. Learners analyze and discuss solutions without having to write a linear equation.
Radford University
Regression Analysis Activity
Don't let your knowledge of regression analysis regress. Pupils take part in three activities to learn about regression curves. They research and collect data to predict how long it will take a basketball to hit the ground, find a...
Curated OER
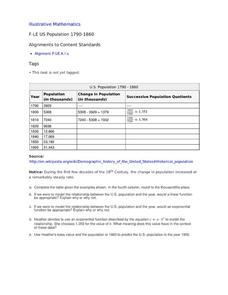
US Population 1790-1860
Your young population scientists analyze a table of values, write a model to represent the real life data, finish the table of data and predict future populations in a collaborative, real-life activity.
EngageNY
Exponential Growth—U.S. Population and World Population
Show how exponential growth can look linear. Pupils come to understand the importance of looking at the entire picture as they compare the US population to the world population. Initially, the populations look linear with the same rate...
CK-12 Foundation
Interpretation of Circle Graphs: Northwest Region Population Pie
Given populations of the five Northwestern states, learners create a circle graph. Using the data and the pie chart, they make comparisons between the populations of the states. Finally, the pupils determine how the chart will change...
Curated OER
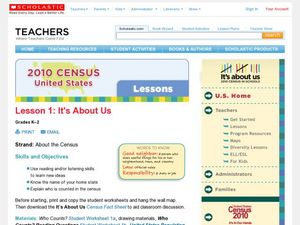
2010 Census Lesson 1: It's About Us
Students analyze data from the 2000 census to learn how the census works. In this civics lesson, students read a story to find out about the census, then use a map and census data to analyze changes. Lesson includes related resources...
Curated OER
Little House in the Census: Almanzo and Laura Ingalls Wilder
How would you use census data from 1880-1900? Here are a set of ways you can incorporate the book Little House on the Prairie and US census data from that time period. Learners will research the validity or the book based on factual...
Curated OER
US City Quality of Life Analysis and Comparison
Students analyze US census data and criteria to compare and measure the quality of life in the country's fifty largest cities. After accessing the 2005 quality of life world report online, students conduct their study to compare three...
Curated OER
The World Population: Logistic Model
Students explore the various uses of the logistic function. Students use the internet to collect world population data and find a logistic model for their data and use their chosen model to predict future populations.
Curated OER
Why Are The Shore Birds Dying?
Students engage in a field study of birds and how they are in danger harm due to environmental factors. They list different possible causes in a prediction activity. The observations are done while writing up data and connecting it to a...
Curated OER
America Moves to the City (1865-1900)
Statistical data can show shifts in human populations without bias or a prescribed historical point of view. View bar graphs and charts that describe new influxes in urbanization, immigration, and suffrage by state during the turn of the...
Annenberg Foundation
Skeeters Are Overrunning the World
Skeeters are used to model linear and exponential population growth in a wonderfully organized lesson plan including teachers' and students' notes, an assignment, graphs, tables, and equations. Filled with constant deep-reaching...
Concord Consortium
Center of Population
Let the resource take center stage in a lesson on population density. Scholars use provided historical data on the center of the US population to see how it shifted over time. They plot the data on a spreadsheet to look the speed of its...
Radford University
Feeding the World
Using technology, pupils find an exponential function to model the population growth of the US. With more information, learners derive the population growth formula for the world. Ultimately, they determine the amount of protein needed...


