Curated OER
Modeling Population Growth
Young scholars create linear, exponential, and quadratic models of U.S. population data to determine which function best represents U.S. population growth. They predict future populations based on each model.
Curated OER
Graphs and Data
Pupils investigate poverty using graphs. In this algebra lesson, students collect data on the effects of poverty and use different rules to analyze the data. They graph and use the trapezoid rule to interpret the data.
Curated OER
Exponential Models
Students fit a constant growth rate exponential model to U.S. population data and use the model to predict future population. They write an equation to determine U.S. population based on constant growth rate model.
EngageNY
Exponential Growth—U.S. Population and World Population
Show how exponential growth can look linear. Pupils come to understand the importance of looking at the entire picture as they compare the US population to the world population. Initially, the populations look linear with the same rate...
Curated OER
Blue Crabs - The Blue Crab's Chesapeake Journey
A plethora of information about the blue crabs of Chesapeake Bay will amaze and delight your marine biologists. They learn, through direct instruction, about the characteristics and life cycle of this fascinating arthropod. A highlight...
Curated OER
200 Years and Counting: How the U.S. Census Tracks Social Trends
Students examine the process of census taking in the United States. In this "200 Years and Counting" activity, students examine the data collection process, look at an example of a census form, analyze data, and learn what the...
EngageNY
Modeling with Exponential Functions
These aren't models made of clay. Young mathematicians model given population data using exponential functions. They consider different models and choose the best one.
Curated OER
Exponential Models
Pupils fit a continuous change exponential model to U.S. population data and use the model to predict future population.
Concord Consortium
People and Places
Graph growth in the US. Given population and area data for the United States for a period of 200 years, class members create graphs to interpret the growth over time. Graphs include population, area, population density, and population...
Curated OER
Look, There's Another One!
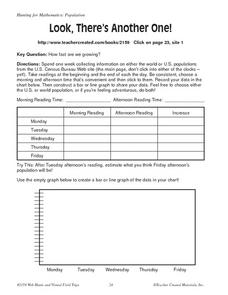
In this math worksheet, students spend a week collecting information on either the word or U.S. populations from the U.S. Census Bureau Web site. Students record their data in a chart and bar graph. Students also use the website to...
Curated OER
Focus on Economic Data: US Employment and the Unemployment Rate, March, 2012
Read all about the various types of unemployment and the United States is are currently at the low-point of an unemployment cycle. Kids examine what economic factors affect the unemployment rate, and what data shows for different US...
Curated OER
Historical Population Changes in the US
Students conduct research on historical population changes in the U.S. They conduct Internet research on the Historical Census Data Browser, create a bar graph and data table using a spreadsheet program, and display and interpret their...
Education World
The African American Population in US History
How has the African American population changed over the years? Learners use charts, statistical data, and maps to see how populations in African American communities have changed since the 1860s. Activity modifications are included to...
Curated OER
Population Growth Rates
Students determine the average annual rate of change (growth rate) of U.S. national population for each decade of historical census data.
Bowland
How Risky is Life?
"Life is more risk management, rather than exclusion of risks." -Walter Wriston. Scholars use provided mortality data to determine how likely it is a person will die from a particular cause. They compare the data to the perception of the...
Curated OER
Lesson 1: Map Data and the Census
Learners learn about the history of the census. For this U. S. Census lesson plan, students develop an understanding about how the United States Constitution grants and distributes power and discover how the spatial organization of...
Curated OER
A look at our larger population
Student team together to tell the story of the U.S.'s rapid population growth. High schoolers research census changes, focusing on changes in the size of the community and the school. Students tell the story by writing articles and...
Concord Consortium
Center of Population
Let the resource take center stage in a lesson on population density. Scholars use provided historical data on the center of the US population to see how it shifted over time. They plot the data on a spreadsheet to look the speed of its...
Cheetah Outreach
Population Change
Your youngsters become cheetahs in search of food, water, shelter, and space in a fun physical game that does a fantastic job of representing fluctuating species population based on resources available over years.
Curated OER
Where Do I Live?
Pupils gain a better understanding of the population of the region they live in by comparing U.S. census data on the internet.
Curated OER
Factors In Population Growth
Students examine both historical and recent estimates of world population. They identify regions of the world that have had significant population growth in the last decade and speculate on reasons for this.
Howard Hughes Medical Institute
Niche Partitioning Activity
Dinnertime on the African savanna is a highly choreographed event! Introduce young ecologists to the concept of niche partitioning through a hands-on activity. Pupils research animal behaviors and use data to develop an understanding of...
Curated OER
US Population 1982-1988
Your algebra learners make predictions using the concepts of a linear model from real-life data given in table form. Learners analyze and discuss solutions without having to write a linear equation.
Curated OER
African American Population Shifts
Students investigate population trends. In this African American history lesson, students access U.S. Census records from 1900 to the present online. Students analyze the migration of African Americans from one area of the U.S. to another.


