US Department of Commerce
Community Change
America is a country on the move. Analyzing data from the Census Bureau, class members gauge the people moving in and out of their areas. An interactive web feature allows pupils to see who is moving out and moving in, while discussion...
Curated OER
Mathemafish Population
It's shark week! In this problem, young mathematically minded marine biologists need to study the fish population by analyzing data over time. The emphasis is on understanding the average rate of change of the population and drawing...
EngageNY
Sampling Variability in the Sample Mean (part 2)
Reduce variability for more accurate statistics. Through simulation, learners examine sample data and calculate a sample mean. They understand that increasing the number of samples creates results that are more representative of the...
Curated OER
College Athletes
When more basketball players are taller than field hockey players at a school, is it safe to say that in general they are always taller? The activity takes data from two college teams and your learners will be able to answer questions...
Curated OER
Eastern European Studies
One worksheet, three projects. Learners explore Eastern Europe and mark Eastern European countries on a map. They then collect and record census data on thirteen different countries, and write a 3-5 page expository essay on one of the...
Curated OER
Ecosystems and Remote Sensing
Young scholars obtain remote sensing data to compare and contrast global biomass data with global temperature data.
Curated OER
Create a Graph Online
Scholars create colorful bar, line, or pie graphs. They decide on a survey question to ask or a type of data to gather. From there, they collect information and data. They display this data in bar, line, or pie graphs that they create...
Curated OER
Gold Rush California and its Diverse Population
Students compare contemporary cultural differences with historical differences based on population percentage. In this cross-curriculum Gold Rush/math lesson plan, students analyze aspects of California's Gold Rush population and...
Howard Hughes Medical Institute
Population Dynamics
Will human population growth always be exponential, or will we find a limiting factor we can't avoid? Young scientists learn about both exponential and logistic growth models in various animal populations. They use case studies to...
Science 4 Inquiry
The Ups and Downs of Populations
Life has its ups and downs ... especially if you're an animal! Biology scholars engage in a population study through an inquiry-based lesson. Pupils work together to explore the factors that affect deer populations, then examine the...
Illustrative Mathematics
Modeling London's Population
Looking at London's population from 1801–1961 in 20 year increments, high school mathematicians determine if the data can be modeled by a given logistic growth equation. They explain their thinking and determine the values of each...
American Statistical Association
Don't Spill the Beans!
Become a bean counter. Pupils use a fun activity to design and execute an experiment to determine whether they can grab more beans with their dominant hand or non-dominant hand. They use the class data to create scatter plots and then...
Beyond Benign
Municipal Waste Generation
Statistically, waste may become a problem in the future if people do not take action. Using their knowledge of statistics and data representation, pupils take a look at the idea of waste generation. The four-part unit has class members...
Howard Hughes Medical Institute
Lactase Persistence: Evidence for Selection
What's the link between lactase persistence and dairy farming? Biology scholars analyze data to find evidence of the connection, then relate this to human adaptation. Working individually and in small groups, learners view short video...
Curated OER
Blue Crabs - The Blue Crab's Chesapeake Journey
A plethora of information about the blue crabs of Chesapeake Bay will amaze and delight your marine biologists. They learn, through direct instruction, about the characteristics and life cycle of this fascinating arthropod. A highlight...
Curated OER
China's Population Growth
Learners collect data from China's population growth and determine the mean, median, and mode from the data. For this data lesson plan, pupils determine probabilities and use them to make predictions.
EngageNY
Margin of Error When Estimating a Population Mean (part 1)
We know that sample data varies — it's time to quantify that variability! After calculating a sample mean, pupils calculate the margin of error. They repeat the process with a greater number of sample means and compare the results.
Radford University
Is it Really a Small World After All?
Working in groups, learners research four countries' populations over the past 30 years. Using the data collected, the teams find regression equations that best fit the data. Taking the regression equations, they then make predictions...
Curated OER
Populations Lab - Cultures Lesson: Statistics / Sampling Patterns
Ninth graders examine the application of statistical sampling, data collection, analysis, and representation that exists in schooling and teenage lifestyles in Japan and the United States.
EngageNY
Margin of Error When Estimating a Population Proportion (part 2)
Error does not mean something went wrong! Learners complete a problem from beginning to end using concepts developed throughout the last five lessons. They begin with a set of data, determine a population proportion, analyze their result...
EngageNY
Sampling Variability
Work it out — find the average time clients spend at a gym. Pupils use a table of random digits to collect a sample of times fitness buffs are working out. The scholars use their random sample to calculate an estimate of the mean of the...
EngageNY
Evaluating Reports Based on Data from a Sample
Statistics can be manipulated to say what you want them to say. Teach your classes to be wise consumers and sort through the bias in those reports. Young statisticians study different statistical reports and analyze them for misleading...
Population Connection
Where Do We Grow from Here?
Did you know that the population is expected to grow to 11 billion by 2100? The resource serves final installment in a six-part series on the global population and its effects. Scholars interpret data from the United Nations about the...
National Wildlife Federation
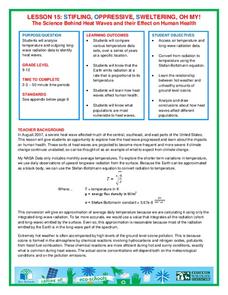
Stifling, Oppressive, Sweltering, Oh My!
Looking for a hot date? Pick any day in August, statistically the hottest month in the United States. The 15th lesson in the series of 21 instructs pupils to investigate the August 2007 heat wave through NASA data, daily temperature...
Other popular searches
- Graphing Population Data
- Population Data Collection
- Us Population Data
- U.s. Population Data
- Population Data Lesson


