National Security Agency
Going Green with Graphs
In this unit designed for second graders, youngsters are introduced to conducting surveys and creating tally charts based on the data they gather. Students then construct bar graphs, and observe the relationships between the two...
Curated OER
Drive the Data Derby
Three days of race car design and driving through the classroom while guessing probability could be a third graders dream. Learn to record car speed, distances traveled, and statistics by using calculation ranges using the mean, median,...
Mathematics Vision Project
Module 5: Features of Functions
The language and features of functions get careful treatment in a complex but doable lesson. Learners get a lot of practice really figuring out what a graph means in context, and also identifying key features of graphs. Key ideas...
National Security Agency
Line Graphs: Gone Graphing
Practice graphing and interpreting data on line graphs with 36 pages of math activities. With rationale, worksheets, and assessment suggestions, the resource is a great addition to any graphing unit.
Mathematics Vision Project
Module 2: Systems of Equations and Inequalities
The brother-sister pair Carlos and Clarita need your class's help in developing their new pet sitting business. Through a variety of scenarios and concerns presented to the siblings, the learners thoroughly explore systems of equations...
Mathematics Vision Project
Module 4: Linear and Exponential Functions
Sequences and series are traditionally thought of as topics for the pre-calculus or calculus class, when learners are figuring out how to develop limits. But this unit uses patterns and slopes of linear functions in unique ways...
Mathematics Vision Project
Module 6: Trigonometric Functions
Create trigonometric functions from circles. The first lesson of the module begins by finding coordinates along a circular path created by a Ferris Wheel. As the lessons progress, pupils graph trigonometric functions and relate them to...
Houghton Mifflin Harcourt
Integers, Opposites, Absolute Value
Straight from the pages of a math textbook, this three-lesson series introduces young mathematicians to the world of integers. Starting with a definition of integers and their applications in the real world, this resource goes on to...
Intel
What Does This Graph Tell You?
What can math say about natural phenomena? The fifth STEM lesson in this project-based learning series asks collaborative groups to choose a phenomenon of interest and design an experiment to simulate the phenomenon. After collecting...
Curated OER
Story Stretching: Tall Tales in North America
Students are introduced to tall tales. In this introductory tall tales unit, students explore the tall tales of Casey Jones and Johnny Appleseed. This unit includes many interdisciplinary lessons including graphing skills and geography.
National Security Agency
It's Probably Probable
Learners make predictions and draw conclusions from given information as they learn the meaning of probability in this vocabulary-rich, integrated activity that presents a variety of teaching strategies to motivate and reach...
Curated OER
You Scratch my Back, I'll Scratch Yours
Students explore the concept of interdependence. In this integrated interdependence lesson, students interpret graphs and charts that require them to analyze the relationship between Mexico and the United States. Students also...
Mathematics Vision Project
Quadratic Equations
Through a variety of physical and theoretical situations, learners are led through the development of some of the deepest concepts in high school mathematics. Complex numbers, the fundamental theorem of algebra and rational exponents...
EngageNY
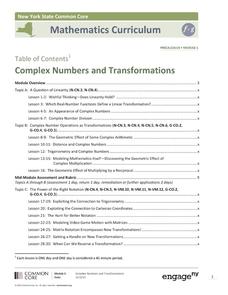
Complex Numbers and Transformations
Your learners combine their knowledge of real and imaginary numbers and matrices in an activity containing thirty lessons, two assessments (mid-module and end module), and their corresponding rubrics. Centered on complex numbers and...
Intel
Play Ball!
Math and sports meet on the baseball diamond in the first STEM lesson in a series of six that asks pupils to collect and perform comparative analyses of data specific to baseball. Following the analysis, scholars create a presentation...
Curated OER
The Hopes of Our Ancestors: The Impact of Immigration on America
Students research the immigration of America. In this American immigration lesson, students complete a unit of activities to learn about American immigration.
Science Education Resource Center at Carleton College
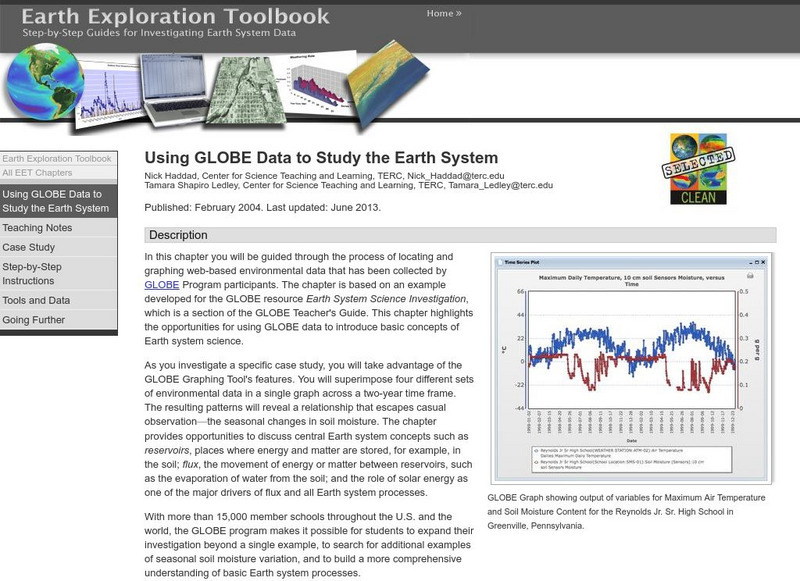
Serc: Using Globe Data to Study the Earth System
This lesson guides students through the process of locating and graphing web-based environmental data that has been collected by GLOBE Program participants. The lesson provides opportunities for using GLOBE data to introduce basic...
TeachEngineering
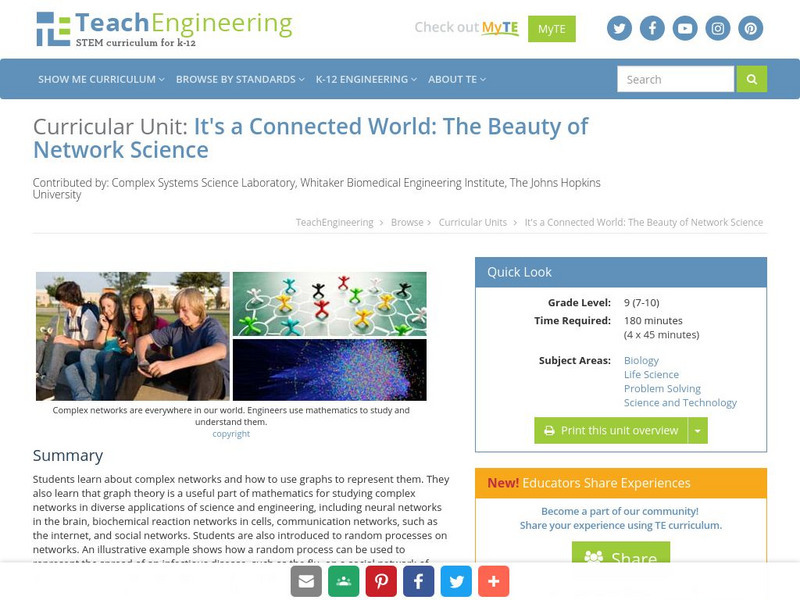
Teach Engineering: It's a Connected World: The Beauty of Network Science
Students learn about complex networks and how to use graphs to represent them. They also learn that graph theory is a useful part of mathematics for studying complex networks in diverse applications of science and engineering, including...


