Curated OER
Input- Output Tables
In this multi-use input-output table activity, students fill in 20 tables to determine the rule for a math sequence or pattern. There are no directions given with this activity.
Curated OER
Input- Output Tables
In this math worksheet, students use 20 empty Input/Output tables for any math function where they are applying a rule to different numbers. There are 4 lines on every table and there is an area to write the rule which is being followed.
Flipped Math
Modeling with Graphs
Create a graph for anything in the world. Pupils continue to work with graphs that model situations. The learners analyze different graphs to answer questions about the scenario along with finding equations of graphs. Scholars use...
Curated OER
Input-Output Tables
In this math worksheet, students complete input-output tables for a math operation or rule. This worksheet contains twenty tables that are multi-purpose for various math operations.
Charleston School District
Tables of Linear Functions
Don't forget the tables! The previous lessons in this five-part series examined the linear equation and graph relationship. The current lesson adds tables to the mix. At completion, individuals should be able to create a table of values,...
California Education Partners
T Shirts
Which deal is best? Learners determine which of two companies has the best deal for a particular number of shirts. They begin by creating a table and equations containing each company's pricing structure. Individuals finish the seventh...
Curated OER
What's My Function?
Students use input / output tables to help them solve algebraic equations. They use patterns and relations to represent and analyze mathematical situations using algebraic symbols.
Education Development Center
Creating a Polynomial Function to Fit a Table
Discover relationships between linear and nonlinear functions. Initially, a set of data seems linear, but upon further exploration, pupils realize the data can model an infinite number of functions. Scholars use multiple representations...
Mathed Up!
Straight Line Graphs
Develop graphs by following the pattern. The resource provides opportunities for reviewing graphing linear equations. Pupils create tables to graph linear equations by using patterns whenever possible. The worksheet and video are part of...
Mathed Up!
Drawing Quadratic Graphs
Curve through the points. The resource, created as a review for the General Certificate of Secondary Education Math test, gives scholars the opportunity to refresh their quadratic graphing skills. Pupils fill out function tables to find...
EngageNY
Comparing Rational Expressions
Introduce a new type of function through discovery. Math learners build an understanding of rational expressions by creating tables and graphing the result.
Curated OER
Function Tables
In this function tables worksheet, 11th graders solve 10 different problems that include completing various function tables. First, they read and identify each rule given for the tables. Then, students use the rule to determine the input...
Curated OER
A Sum of Functions
Collaborative learners will see the geometric addition of functions by graphing the sum of two graphed curves on the same coordinate plane. This task then naturally flows into giving learners the algebraic representation of the curves...
Curated OER
Function Tables
In this function rules worksheet, students complete each function table or rule. Students complete the input and output sections for each table using the given numbers. Students complete two test prep questions.
Pennsylvania Department of Education
What is the Chance?
Fourth and fifth graders make predictions using data. In this analyzing data lesson plan, pupils use experimental data, frequency tables, and line plots to look for patterns in the data in order to determine chance. You will need to make...
Charleston School District
Pre-Test Unit 3: Functions
How does an input affect an output? Assess your learners' ability to answer this question using this pre-test. Scholars answer questions about the basics of a function. Topics include determining if a table or statement represents a...
Charleston School District
Review Unit 3: Functions
Time to show what you know about functions! The review concludes a series of nine lessons on the basics of functions. The problems included are modeled from the previous lessons. Pupils determine if a table represents a function,...
Project Maths
Introduction to Patterns
The world is full of patterns. Help learners quantify those patterns with mathematical representations. The first Algebra lesson in a compilation of four uses a series of activities to build the concept of patterns using multiple...
Curated OER
Mixed Tables
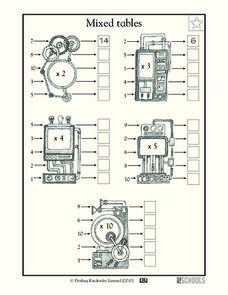
Who knows how to operate these multiplication machines? Young mathematicians examine five machines, each with a specific function (i.e. x3) to transform the input numbers to output numbers. They send five numbers through each machine,...
EngageNY
Solution Sets to Equations with Two Variables
Can an equation have an infinite number of solutions? Allow your class to discover the relationship between the input and output variables in a two-variable equation. Class members explore the concept through tables and graphs and...
Curated OER
Function Tables
Pupils identify function using tables of data. In this algebra activity, students create a tale of point and plot on a coordinate plane. They analyze the graph as being a function or not.
Curated OER
Functions Tables Activity
In this functions worksheet, students complete a set of 4 function tables using a given rule, then answer a set of 3 additional related questions. Answers are included on page 2.
Illustrative Mathematics
Foxes and Rabbits 1
Here is where algebra learners begin to understand that a function is a rule, and for each input there is exactly one output. The commentary gets bogged down with information about the predator-prey relationship between the fox and...
College Board
2003 AP® Microeconomics Free-Response Questions Form B
How are monopolies and competitive firms similar and different? Scholars consider the question using authentic College Board materials. Other prompts consider supply and demand curves and the relationship between wages and output.
Other popular searches
- Rules Input Output Tables
- Math Input Output Tables
- Algebra Input Output Tables
- Input/output Tables Grade 4
- Function Input Output Tables
- Input/output Tables Grade 8
- Input/output Tables Math
- Graphing Input/output Tables
- Free Input/output Tables
- Input/output Tables Grade 5
- Input/output Tables Science


