DocsTeach
Analyzing Photographs of the Triangle Shirtwaist Factory Fire
While a catalyst for the labor movement, 146 people lost their lives in the Triangle Shirtwaist Factory Fire in 1913. A series of photographs of the aftermath of the tragedy help young historians consider the impact of the fire. The...
Facing History and Ourselves
The Power of Images
One picture but a thousand stories. As a part of a case study of how the death of Michael Brown was reported by professional news sources and on social media class members examine the reactions of various groups to a photograph taken by...
Museum of the American Revolution
Image Analysis: In Their Own Words
Images often convey more than words. Scholars examine political cartoons from the American Revolution to understand how images have the ability to express political ideas. Academics participate in group discussion, complete a worksheet,...
Curated OER
Analyzing Photographs: From Theory to Practice
Students analyze photographic images and use cameras to document their own life. In this analyzing photography lesson, students apply formal analysis techniques to images, then create a documentary of photographic images with artist...
DocsTeach
Patent Analysis: Joseph Glidden's Barbed Wire
Barbed wire may have made cattle farming easier, but it brought to an end the free-roaming days of the plains. No longer could Native American groups continue their nomadic lifestyle, and the days of cowboys herding large groups of...
DocsTeach
Boston Tea Party Image Analysis
Elementary scholars become Sherlock Holmes to analyze a lithograph showcasing the Boston Tea Party. Scholars view the image with some pieces missing and must write an observation. Individuals are then shown the whole image and asked to...
Newseum
Political Persuasion: It’s All About Image
Political candidates work hard at creating an image they believe will appeal to voters. High schoolers collect 10 photos and other images of a candidate and analyze them to determine what techniques create a positive or negative impression.
Curated OER
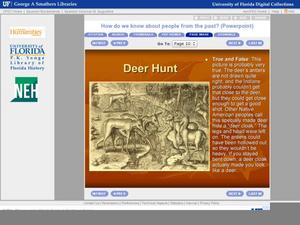
How Do We Know About People From The Past?
It's not enough to see or just read a primary source document; one has to analyze them fully to understand their historical implications. First learners are introduced to what primary and secondary sources are, then they read a bit of...
Curated OER
Lesson 1: English-Indian Encounters
What did the English settlers think of the Native Americans inhabiting the Chesapeake region of the United States? Learners analyze a series of documents and images to determine the English perception of the local inhabitants. A great...
Curated OER
Basic Art Analysis Worksheet
This is a terrific art analysis worksheet that has kids thinking critically about art, symbolism, and history. They answer several questions regarding basic art elements and then delve into a thoughtful analysis.
Curated OER
Introduction to Representing and Analyzing Data
Represent data graphically. Allow your class to explore different methods of representing data. They create foldables, sing songs, and play a dice game to reinforce the measures of central tendency.
Curated OER
The Statue of Liberty: The Meaning and Use of a National Symbol
Engage your class in a series of activities, each related to the use or analysis of symbols used to convey patriotic or national concepts. They identify different national symbols and explain their meanings, discussing the importance of...
Encyclopedia Britannica
Campaign Photo Analysis
It's the art of the image! As part of a study of the 2020 Presidential race, groups analyze an image of a candidate, first from an objective point of view and then subjectively. They then prepare a presentation detailing what they...
CK-12 Foundation
Graphs for Discrete and for Continuous Data: Discrete vs. Continuous Data
Not all data is the same. Using the interactive, pupils compare data represented in two different ways. The learners develop an understanding of the difference between discrete and continuous data and the different ways to represent each...
Curated OER
Propaganda and World War II
What was the true meaning behind WWII propaganda posters? Historians analyze images from the U.S., Great Britain, Nazi Germany, and the Soviet Union, sharing findings in small groups. A poster analysis worksheet and all posters are...
DocsTeach
Challenger Explosion Photograph Analysis
Young historians turn into detectives in a thought-provoking activity on the Challenger Explosion. The activity uses an image of President Reagan watching the Challenger explode on live TV to help academics practice historical analysis....
CK-12 Foundation
Types of Data Representation: Baby Due Date Histogram
Histograms are likely to give birth to a variety of conclusions. Given the likelihood a woman is to give birth after a certain number of weeks, pupils create a histogram. The scholars use the histogram to analyze the data and answer...
DocsTeach
Suffrage Photograph Analysis
Votes for women! Young scholars use images to explore the suffrage movement and its impact on the United States. Historians work in groups or pairs to interpret the photograph, complete a worksheet, and discuss how their opinions of the...
Houghton Mifflin Harcourt
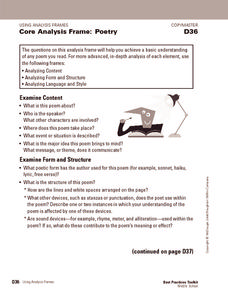
Core Analysis Frame: Poetry
Dig deep into any piece of poetry with a set of analysis questions. Ponder the content, form, and language of poetry and provide some question for critique. The first two pages include general questions, and the remainder of the document...
EngageNY
Grade 9 ELA Module 4, Unit 1, Lesson 7
Class members examine the images Arson and Budhos use to depict the working conditions on the sugar plantations and consider how these images support the arguments the writers present in Sugar Changed the World.
Curated OER
Count the Images!
Based on a selection of images, learners create a bar graph depicting how many of each image is shown. There are two graphs, each with three images to chart. After they are finished, scholars can analyze the data and draw conclusions. To...
Brigham Young University
Introducing the Text and Learning the Process of Script Analysis
Where do directors and set designers get their ideas so that the set they build creates the mood and atmosphere the director wants for a production? From the script! Introduce theater high schoolers to the script analysis techniques used...
Museum of the Moving Image
Developing Critical Analysis
To gain an understanding of how images and sounds are used to influence viewers, class members analyze these features in Presidential campaign commercials from 1952-2012.
DocsTeach
Analyzing an Allegorical Statue
Everyone sees art differently. An informative resource focuses on the image analysis of an allegorical statue. Scholars study the photo of the statue and complete a worksheet based on their findings. To finish, academics participate in...


