EngageNY
Interpreting the Standard Deviation
Does standard deviation work for non-symmetrical distributions, and what does it mean? Through the use of examples, high schoolers determine the standard deviation of a variety of distributions and interpret its meaning. Problems require...
EngageNY
Analyzing Residuals (Part 1)
Just how far off is the least squares line? Using a graphing calculator, individuals or pairs create residual plots in order to determine how well a best fit line models data. Three examples walk through the calculator procedure of...
EngageNY
Analyzing Data Collected on Two Variables
Assign an interactive poster activity to assess your class's knowledge and skill concerning data analysis. The teacher reference provides solid questions to ask individuals or groups as they complete their posters.
EngageNY
Changing the Base
I can't calculate a base-2 logarithm since my calculator doesn't have a base-2 log key. Young mathematicians use the change of base formula to extend the properties of logarithms to all bases. Among these bases is the natural log base,...
EngageNY
Solving Equations Involving Linear Transformations of the Coordinate Space
Explore methods for solving linear systems with your classes and introduce learners to using matrices as a viable method. Scholars are able to recognize situations where matrices are the efficient method of solving. Application questions...
EngageNY
Making Fair Decisions
Life's not fair, but decisions can be. The 17th installment of a 21-part module teaches learners about fair decisions. They use simulations to develop strategies to make fair decisions.
EngageNY
More Practice with Box Plots
Don't just think outside of the box — read outside of it! The 15th activity in a 22-part unit provides pupils more work with box plots. Learners read the box plots to estimate the five-number summary and interpret it within the context....
EngageNY
Understanding Box Plots
Scholars apply the concepts of box plots and dot plots to summarize and describe data distributions. They use the data displays to compare sets of data and determine numerical summaries.
Curated OER
The Luxor Hotel Contract
High schoolers determine the surface area of the Luxor Hotel, using the square feet of the base, volume, and the volume formula. They create a scale model of the triangular/pyramid shaped hotel.
Curated OER
Cultural Environment during the Great Depression
Eleventh graders research American culture of the Great Depression. In this role-playing lesson, groups of students develop "talking points" for their assigned topic and condense them into a Powerpoint or Hyper Studio presentation.
Curated OER
Anne Frank Brochure/Newsletter
Any lesson that includes time at the computer lab is a favorite for the kids! In this plan, the class heads to the lab to research Anne Frank and her life. Using both Internet and print resources (like the book), pupils compile...
Noyce Foundation
Pizza Crusts
Enough stuffed crust to go around. Pupils calculate the area and perimeter of a variety of pizza shapes, including rectangular and circular. Individuals design rectangular pizzas with a given area to maximize the amount of crust and do...
Noyce Foundation
Which is Bigger?
To take the longest path, go around—or was that go over? Class members measure scale drawings of a cylindrical vase to find the height and diameter. They calculate the actual height and circumference and determine which is larger.
Inside Mathematics
Quadratic (2009)
Functions require an input in order to get an output, which explains why the answer always has at least two parts. After only three multi-part questions, the teacher can analyze pupils' strengths and weaknesses when it comes to quadratic...
Space Awareness
The Climate in Numbers and Graphs
Weather versus climate: weather relates to short time periods while climate averages the weather of a period of many years. Scholars learn about average temperature and precipitation in various climate zones and then apply statistics...
Massachusetts Institute of Technology
Sentence Structure of Technical Writing
Most teachers and scholars look for a way to simplify information. Informational how-to slides simplify the process of technical writing into a step-by-step process. Learners gather information on what to do, as well as what to avoid....
Discovery Education
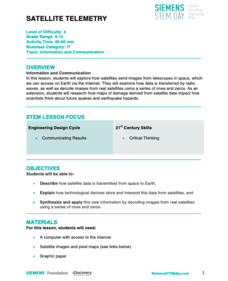
Satellite Telemetry
Satellites require rockets to launch, but it doesn't take a rocket scientist to understand them. Future engineers learn about how satellites send data to Earth and how to interpret satellite images. They see how radio waves play a role...
Curated OER
Getting It Right!
Young scholars construct right triangles, measuring the sides and recording the measurements in spreadsheets. They analyze their measurements for patterns and research the Internet for information on Pythagoras.
Curated OER
Discovering Pi
Sixth graders measure circumference and diameter to the nearest eighth of an inch, record measurements on a spreadsheet, and use the internet to complete a "scavenger hunt" of facts concerning pi.
Curated OER
Weather Forecast
Students forecast the weather. In this weather instructional activity, students are assigned a day to give the weather forecast. Students write a script and video their weather forecast.
Curated OER
Food Chains
Students study food chains by creating their own slide show using KidPix. They compare information after sharing their slide shows as a whole group. As the children are watching the slide shows of their peers, they tally every time...
Curated OER
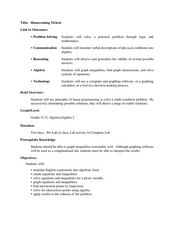
Homecoming Tickets
Students solve word problems using systems of equation. In this algebra lesson, students use computer and graphing to graph and analyze their solution. They solve system involving inequalities.
Curated OER
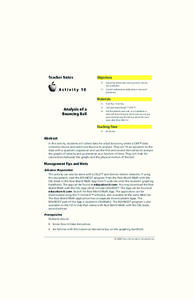
Bouncing Ball Experiment
Students collect data for a bouncing ball and select one bounce to analyze. They explore the relationship between velocity, position and acceleration. They seek out connections between the graphs and the physical motion of the ball.
Curated OER
Metamorphosis
Students select organic object and transform it to an inorganic object in five or six steps, and complete value rendered drawings.


