Curated OER
Birds' Eggs
More than just data, scatter plots are full of information that can be used to answer a variety of questions. This lesson uses a plot with information about bird egg sizes to answer questions about the relationship between length and...
EngageNY
Relationships Between Two Numerical Variables
Is there another way to view whether the data is linear or not? Class members work alone and in pairs to create scatter plots in order to determine whether there is a linear pattern or not. The exit ticket provides a quick way to...
Curated OER
Animal Brains
Do big bodies make big brains? Let your learners decide whether there is an association between body weight and brain weight by putting the data from different animals into a scatterplot. They can remove any outliers and then make a line...
EngageNY
Analyzing Residuals (Part 1)
Just how far off is the least squares line? Using a graphing calculator, individuals or pairs create residual plots in order to determine how well a best fit line models data. Three examples walk through the calculator procedure of...
Curated OER
Hand Span and Height
Is there a relationship between hand span width and height? Statisticians survey each other by taking measurements of both. A table that can hold data for 24 individuals is printed onto the worksheet, along with questions for analysis....
Concord Consortium
Here Comes the Sun
Many phenomena in life are periodic in nature. A task-based lesson asks scholars to explore one of these phenomena. They collect data showing the sunrise time of a specific location over the period of a year. Using the data, they create...
EngageNY
More on Modeling Relationships with a Line
How do you create a residual plot? Work as a class and in small groups through the activity in order to learn how to build a residual plot. The activity builds upon previous learning on calculating residuals and serves as a...
Balanced Assessment
A Fishy Story
There's nothing fishy about this resource. In the task, learners use given information about fish prices to create a scatter plot and line of best-fit. Later, they use the information to answer questions about the profit from fish sales.
EngageNY
Analyzing Residuals (Part 2)
Learn about patterns in residual plots with an informative math activity. Two examples make connections between the appearance of a residual plot and whether a linear model is the best model apparent. The problem set and exit ticket...
Balanced Assessment
Compact-Ness
Creating a definition may be easier than it sounds! Give your classes experience creating their own definition. Scholars examine the meaning of the compact-ness of a scatter plot and create their own definitions based on measurements.
Concord Consortium
People and Places
Graph growth in the US. Given population and area data for the United States for a period of 200 years, class members create graphs to interpret the growth over time. Graphs include population, area, population density, and population...
Mathematics Assessment Project
Middle School Mathematics Test 3
Real-life mathematics is not as simple as repeating a set of steps; pupils must mentally go through a process to come to their conclusions. Teach learners to read, analyze, and create a plan for solving a problem situation. The...
Concord Consortium
Broken Spreadsheet I
There is power in spreadsheet formulas and learners use this power to model quadratic data. Given a scatterplot of a parabola, pupils create formulas in a spreadsheet to populate the data. The formulas they use lead to an understanding...
CCSS Math Activities
Smarter Balanced Sample Items: High School Math – Claim 4
What is the appropriate model? Sample problems show the extent of the Smarter Balanced assessments Claim 4, Modeling and Data Analysis. Items provide pupils the opportunity to use mathematical modeling to arrive at a reasonable answer....
CCSS Math Activities
Smarter Balanced Sample Items: 8th Grade Math – Claim 4
A math model is a good model. A slide show presents 10 sample items on modeling and data analysis. Items from Smarter Balanced illustrate different ways that Claim 4 may be assessed on the 8th grade math assessment. The presentation is...
EngageNY
Interpreting Residuals from a Line
What does an animal's gestation period have to do with its longevity? Use residuals to determine the prediction errors based upon a least-square regression line. This second lesson plan on residuals shows how to use residuals to...
College Board
2015 AP® Statistics Free-Response Questions
Statistics is all about making inferences. Can you infer how your pupils will fair on their AP® exams? Collect your own data by giving them practice tests such as the 2015 free-response exam. The six-question test includes topics such as...
College Board
2008 AP® Statistics Free-Response Questions Form B
To know what is on the test would be great. The six free-response question from the second form of the 2008 AP® Statistics gives pupils an insight into the format and general content of the exam. Each question requires the test...
Concord Consortium
Gestation and Longevity
Is the gestation length of an animal a predictor of the average life expectancy of that animal? Learners analyze similar data for more than 50 different animals. They choose a data display and draw conclusions from their graphs.
College Board
1998 AP® Statistics Free-Response Questions
Free-response questions form the 1998 AP® Statistics exam allow class members to analyze data from real-life situations. The situations include tracking defective parts, tracking butterflies, evaluating weed killers and determining...
CCSS Math Activities
Smarter Balanced Sample Items: High School Math – Claim 2
Problem solve across the content standards. The presentation slides provide 19 sample items from the Smarter Balanced high school assessment. Items illustrate Claim 2, problem solving, of the test and are drawn from all the high school...
Curated OER
Basketball Bounces, Assessment Variation 1
This highly scaffolded, summative assessment tasks learners to choose the model that represents the height of a bouncing basketball given the data in graph and table form. Learners then use the model to answer questions about the...
Curated OER
Coffee and Crime
Is there a correlation between the number of coffee shops and the amount of crime in a given area? In this quick exercise, your class will examine the data, interpret the results, and discuss their conclusion. Concepts covered include...
Khan Academy
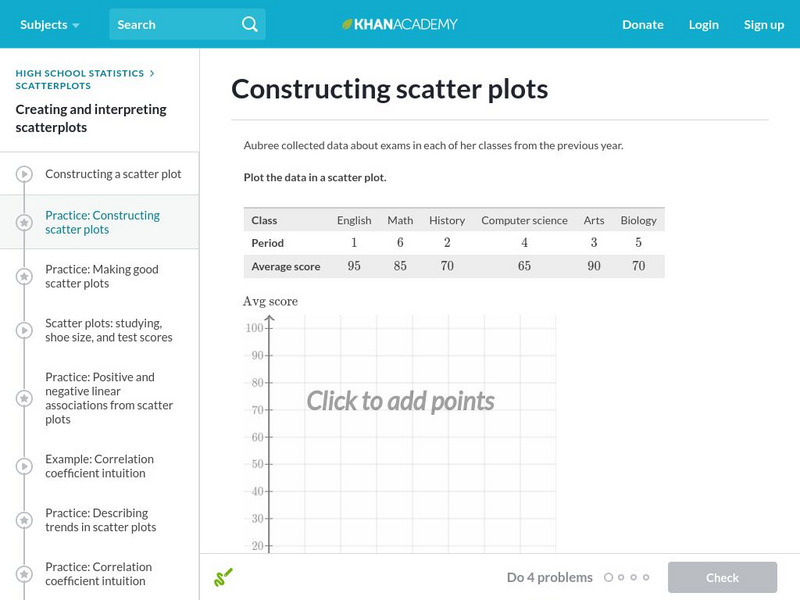
Khan Academy: Constructing Scatter Plots
Practice plotting points to construct a scatter plot. Students receive immediate feedback and have the opportunity to try questions repeatedly, watch a video, or receive hints.


