US Department of Commerce
Featured Activity: Population Change Over Time
Keep track of a state's population. After a brief discussion on how population data is used for funding, individuals look at population changes over time. Pupils find the population of two states using three different censuses. They then...
PBS
The Lowdown — Exploring Changing Obesity Rates through Ratios and Graphs
Math and medicine go hand-in-hand. After viewing several infographics on historical adult obesity rates, pupils consider how they have changed over time. They then use percentages to create a new graph and write a list of questions the...
PBS
The Lowdown — What You Need to Know about Immigration Reform
We're all from somewhere. An informative interactive provides information on immigration, foreign-born residents, and deportations. Pupils interpret the graphics to analyze how these quantities have changed over time. The resource is...
US Department of Commerce
Immigration Nation
People come and people go. Given tabular census data on the annual number of immigrants from four different regions of the world between 2000 and 2010, pupils create double bar graphs and line graphs from the data. They analyze their...
Illustrative Mathematics
The High School Gym
Learners apply critical thinking skills as they analyze data about the temperature inside a gymnasium during a school assembly. The focus is on representing temperature as a function of time and interpreting input and output values...
PBS
The Lowdown — Poverty Trends: What Does It Mean to Be Poor in America?
Here's a resource that's rich with learning opportunities. Future mathematicians investigate the poverty rate in America over time. They use an interactive to compare the poverty rate during the Great Recession of 2008 to other years,...
PBS
Real-World Proportional Relationships: Gender Wage Gap
When will the gender wage gap disappear? Scholars use a provided infographic to see trends in wage gap over time. They use ratios of women's wages to men's wages to determine which decades had the greatest change in the wage gap. The...
Curated OER
Mathemafish Population
It's shark week! In this problem, young mathematically minded marine biologists need to study the fish population by analyzing data over time. The emphasis is on understanding the average rate of change of the population and drawing...
Illustrative Mathematics
The Price of Bread
As part of an initiative to strengthen our young adults' financial understanding, this problem explores the cost of bread and minimum wage since the 1930s. Learners are asked to find the percent increase from each year and compare it...
PBS
What We Do Adds Up
With so many tons of trash going into landfills each year, your environmentalists can calculate how much the average person is tossing away. This activity has a series of questions not only requiring math, but a conscious thought of how...
Curated OER
Sunrise, Sunset
What locations on Earth get the longest number of hours of daylight in the summer? Hint: It's not the equator! Use real-world sunrise and sunset data to develop trigonometric models that can be used to estimate the number of hours of...
101 Questions
Slow Church
The church that just can't stay put! A video presentation raises questions of just how far the church will move. Presented with the rate of movement and a range of time expected, scholars build an inequality to answer the question.
Las Cumbres Observatory
Plotting a Supernova Light curve
Supernovas burn for a short time but can give scientists extensive information about the universe. Learners analyze given data about the change in the light magnitude of a supernova. They look for patterns in the data and use them to...
Illustrative Mathematics
Riding by the Library
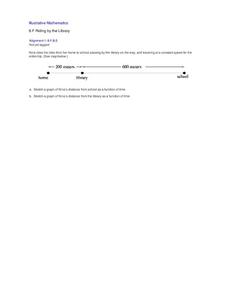
Draw a graph that shows the qualitative features of a function that has been described verbally. Make sure learners understand where time is zero and the distance is zero. It may take them some time to understand this concept, so working...
National Park Service
It Was a Very Good Year
Waterton-Glacier International Peace Park includes whitebark pines that are over 1,200 years old, meaning they have been there since before medieval times. The second lesson of five details how to read tree rings for climate change and...
PBS
Population Simulation with M&M's
Math and M&Ms® go great together when introducing a modeling activity. Allow your learners to simulate population growth and decay of fish in a pond and share their reasoning for the change in fish. With such an impact we have on our...
Curated OER
Carbon 14 Dating, Variation 2
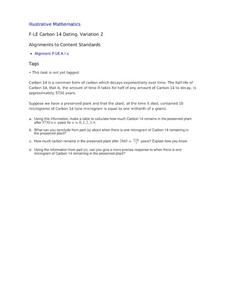
Your archaeologists begin this task with a table of values to estimate the time passed based on the half-life of Carbon 14 remaining in a plant. They then move on to find when a specific amount of Carbon 14 is present in the same plant,...
Illustrative Mathematics
Accuracy of Carbon 14 Dating II
The scientific issue of carbon-14 dating and exponential decay gets a statistics-based treatment in this problem. The class starts with a basic investigation of carbon content, but then branches out to questions of accuracy and...
Teach Engineering
Grow Your Own Algae!
Develop a model of a wastewater treatment center. The last activity of the unit has pupils mix a lake water sample into a tank of water containing fertilizers. Over time, the algae from the lake water grows and removes the nutrient-rich...
The New York Times
Understanding the Mathematics of the Fiscal Cliff
What exactly is the fiscal cliff? What are the effects of changing income tax rates and payroll tax rates? Your learners will begin by reading news articles and examining graphs illustrating the "Bush tax cuts" of 2001 and 2003. They...
Curated OER
In the Billions and Exponential Modeling
Modeling population growth gives learners an opportunity to experiment with real data. Comparing the growth rates in this real-life task strengthens learners' understanding that exponential functions change by equal factors over equal...
Curated OER
Five by Two
Help young mathematicians read and interpret numbers from 1 to 10 and sequence them correctly with this card game. Using a deck of cards and two to three classmates, have one player hand out ten cards to each gamer and then put the extra...
District 158
Plan an Adventure
For kids, taking a vacation is all fun and games, but after completing this pre-algebra project, they'll have a whole new appreciation for the planning that makes these trips possible. Given a budget of $5,000 to spend on purchasing the...
Illustrative Mathematics
Logistic Growth Model, Abstract Version
Here learners get to flex some serious algebraic muscles through an investigation of logistic growth. The properties of the constant terms in the logistic growth formula are unraveled in a short but content-dense...


