College Board
2005 AP® Statistics Free-Response Questions Form B
Here's another great way to learn from the past. Released free-response questions provide a look into how concepts measured on the 2005 AP® Statistics Exam on Form B. Teachers and pupils review questions that cover concepts such as...
College Board
2007 AP® Statistics Free-Response Questions Form B
So that is how they do it! Pupils and teachers see how College Board assesses topics using the free-response questions from Form B of the 2007 AP® Statistics test. The six questions are divided in two sections, the first five being more...
College Board
2008 AP® Statistics Free-Response Questions Form B
To know what is on the test would be great. The six free-response question from the second form of the 2008 AP® Statistics gives pupils an insight into the format and general content of the exam. Each question requires the test taker to...
Radford University
Statistical Study
Put your knowledge of sample surveys to good use. Pupils begin by conducting a survey of class members. They identify an appropriate topic and sampling technique; collect and organize their data; compute and analyze statistical measures;...
Flipped Math
Unit 4 Review: One Variable Statistics
It's always nice to slow down and review. Scholars work on problems covering concepts on one-variable statistics. They create and interpret box plots and stem-and-leaf plots, determine the mean, median, mode, interquartile range, and...
Curated OER
Accidents Happen: Seat Belt Laws, Enforcement, and Usage
Start with a NOVA video about car crashes, crash test dummy footage, or other video about seat belt use. Or have groups review attached data about seat belt usage (by state) and share their conclusions. Learners then devise a method to...
Mathematics Vision Project
Module 8: Modeling Data
Statistics come front and center in this unit all about analyzing discrete data. Real-world situations yield data sets that the class then uses to tease out connections and conclusions. Beginning with the basic histogram and...
Curated OER
Statistical Process Control
Students brainstorm items they have that use memory and view Statistical Process Control PowerPoint presentation. They complete Statistical Process Control Simulation/experiment then find the average, range and standard deviation in...
Curated OER
Statistics
In this statistics worksheet, learners solve and complete 6 different problems that include determining various types of statistics. First, they determine the data set where the median value is equal to the mean value. Then, students use...
Curated OER
Statistics
In this statistics activity, 9th graders solve and complete 10 various types of multiple choice problems. First, they determine the mean number of miles per day that were completed. Then, students determine the data set that has a median...
Curated OER
Statistics for Graphing
Students use the Internet to access a variety of websites that present statistics and information for use in graphing. They represent sports statistics, geographical measurements, temperatures and more.
PBS
Stereotypes vs. Statistics (Grades 4-8)
Stereotypes can be painful if they are used to discriminate against others. Statistics, however, can be helpful in dispelling myths propagated by stereotypes. Using a thoughtful lesson plan, scholars complete graphic organizers and...
Curated OER
Flicking Football Fun
Young mathematicians fold and flick their way to a deeper understanding of statistics with a fun, hands-on math unit. Over the course of four lessons, students use paper footballs to generate data as they learn how to create line...
Curated OER
A Statistical Study of the Alphabet
Students determine probability by completing statistical study on letters of the alphabet and comparing and contrasting results.
Curated OER
Recycling Statistics
In this environment worksheet, students look for the answers to the environmental impact of recycling in Great Britain with the statistics from the pie graph.
Curated OER
Statistics
In this statistics activity, 9th graders solve and complete 10 various types of problems that include using different types of graphs to illustrate data. First, they determine the median score for each stem-and-leaf plot. Then, students...
Curated OER
Statistics - Central Tendency
In this statistics worksheet, students solve and complete 13 different problems that include creating various box-and-whisker plots. First, they write a definition for mean, median, mode and range. Then students explain how to determine...
Curated OER
Statistics Problems
In this statistics worksheet, 3rd graders answer questions about different graphs including bar graphs, picture graphs, line graphs, and more. Students complete 20 multiple choice questions.
Curated OER
Probability and Statistics Pre-Test
In this statistics and probability interactive worksheet, students answer ten multiple choice questions by applying the principles of probability.
Curated OER
Interpreting Data and Statistics
Students define terms and analyze data. For this statistics lesson, students plot their data using bar and line graphs. They analyze their data after they graph it and apply the results to the Great Depression.
Curated OER
Jeopardy - Statistics
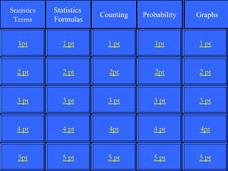
Jeopardy! " I would like Statistics Terms for 5 points Alex". Review, refresh, reinforce statistics terms and formulas for that upcoming quiz. Get your whole class involved by having them use individual whiteboards.
College Board
Calculations Aren't Enough!
Unlike mathematics, statistics comes with a context. The author reminds teachers that data analysis involves using the context to make sense of the numbers. The article stresses good communication skills by highlighting the scoring...
Curated OER
Did Voters Turn Out -- or Are They Turned Off?
What was the voter turnout at your last state election? Examine voter turnout statistics from the most recent election to learn which ten states have the best turnout record. This lesson offers election data, handouts, and worksheets.
College Board
Special Focus: Inference
Statistics is all about making inferences! A lesson guide explains the meaning of inferences and how to use statistics to make them. The resource provides instruction as well as information about the topic on the AP® Statistics exam.
Other popular searches
- Data, Census, & Statistics
- Probability and Statistics
- Educational Statistics
- Baseball Statistics
- Math Statistics
- Climate Statistics
- Math Lessons Statistics
- Median and Mean Statistics
- Statistics Lesson Plans
- Sports and Statistics
- Probability Statistics
- Black Plague Statistics


